November, 2023 Eye on Research
Commentary
Just released by Intelligent.com, based on their survey of 800 employers, are the following statistics.
-
45% of companies–plan to eliminate bachelor’s-degree requirements for some positions in 2024
-
55% of companies–eliminated bachelor’s-degree requirements in 2023
-
70% state they eliminated bachelor’s-degree requirements to create a more diverse workforce
-
4 in 5 employers value experience over education, when evaluating job candidates
-
66% of employers have candidates complete test assignments
Given the above statistics, it is imperative for higher education to establish credential standards and agreed-upon definitions for incremental credentials. I recently conducted a Google search for higher-education definitions of “badge” and “microcredential,” sometimes spelled as “micro credential.” I found nearly a dozen different definitions on the first search-results page for each term. In some definitions, a microcredential leads to a badge, and in others, the definitions of microcredential and badge are two distinct types of an incremental credential.
Achieving greater clarity and consistency in these various definitions now in use is necessary given the rapidly changing hiring patterns of employers and learning patterns of students. Collaborative efforts and ongoing discussions are essential to address this challenge and adapt to the changing educational landscape now, not several months or years from now.
I was also curious how ChatGPT would define the terms badge and microcredential in the context of higher education. Here is what my research produced.
A microcredential in higher education refers to a small, focused, and often specialized learning program or credential that is designed to provide learners with specific skills, knowledge, or competencies in a relatively short period of time. Microcredentials are typically shorter and more narrowly focused than traditional degree programs or certificates, making them a flexible and accessible option for individuals looking to acquire targeted expertise or update their skills.
A badge typically refers to a digital or physical representation of a specific accomplishment, skill, or achievement earned by a student or learner. These badges are awarded as a way to recognize and validate a person's competence or proficiency in a particular area of study or skill set. Badges are often used to supplement traditional academic credentials like degrees and certificates and provide a more granular and detailed view of a person's abilities.
The similarities and differences between the two, as summarized by ChatGPT, are shown below.
While microcredentials and badges share similarities in terms of being digital, competency-based, and supportive of lifelong learning, they differ in their scope, duration, structure, and use cases. Microcredentials are often more comprehensive and programmatic, whereas badges are more discrete and flexible in recognizing smaller achievements and skills. The choice between the two depends on the specific learning goals and needs of the individual or organization.
So given your understanding of these terms, how did ChatGPT do?
AACRAO Research Update
Operational Efficiency in Academic Operations
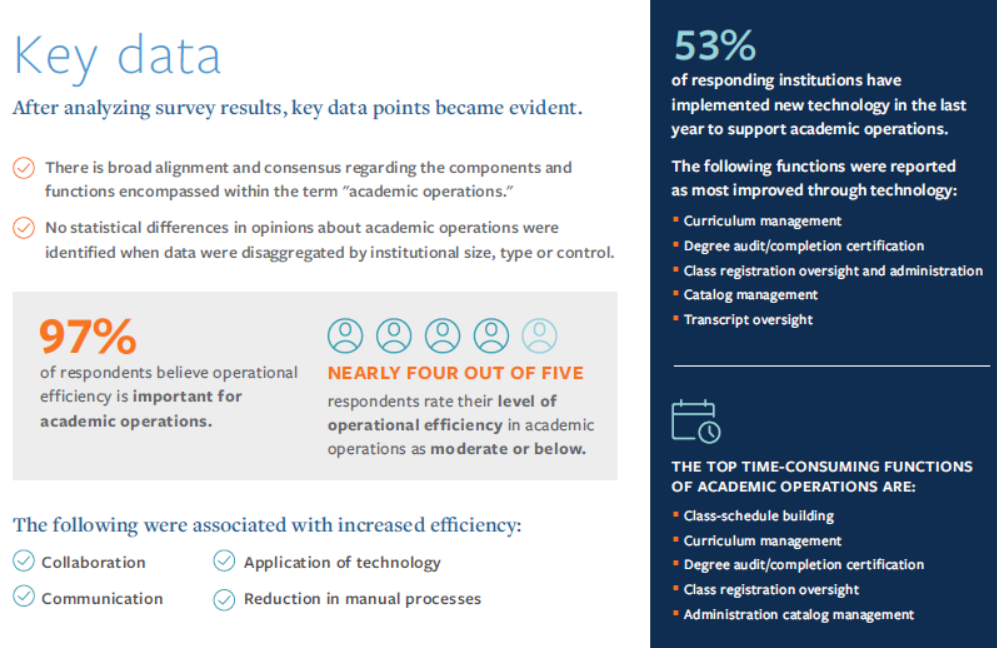
We recently released the results of a 60-Second survey on operational efficiency in academic operations in partnership with Ad Astra. Key data points are summarized in the report extract below. Figure 1
Figure 1: Key data extract from the operational efficiency in academic operations report
2023 U.S. Chief Enrollment Management Officer (CEMO) Career Profile
I am in the process of writing the report based on this year’s survey results from the responses of 205 U.S. Chief Enrollment Management Officers (CEMOs). The report will be shared in January, 2024.
Results paint a comprehensive picture of the CEMO role in higher education, highlighting the challenges, responsibilities and aspirations associated with this pivotal position. Several common denominators about the role and position of CEMOs in higher education were revealed, including the following. CEMOs have:
-
a central role in strategic management at an institution
-
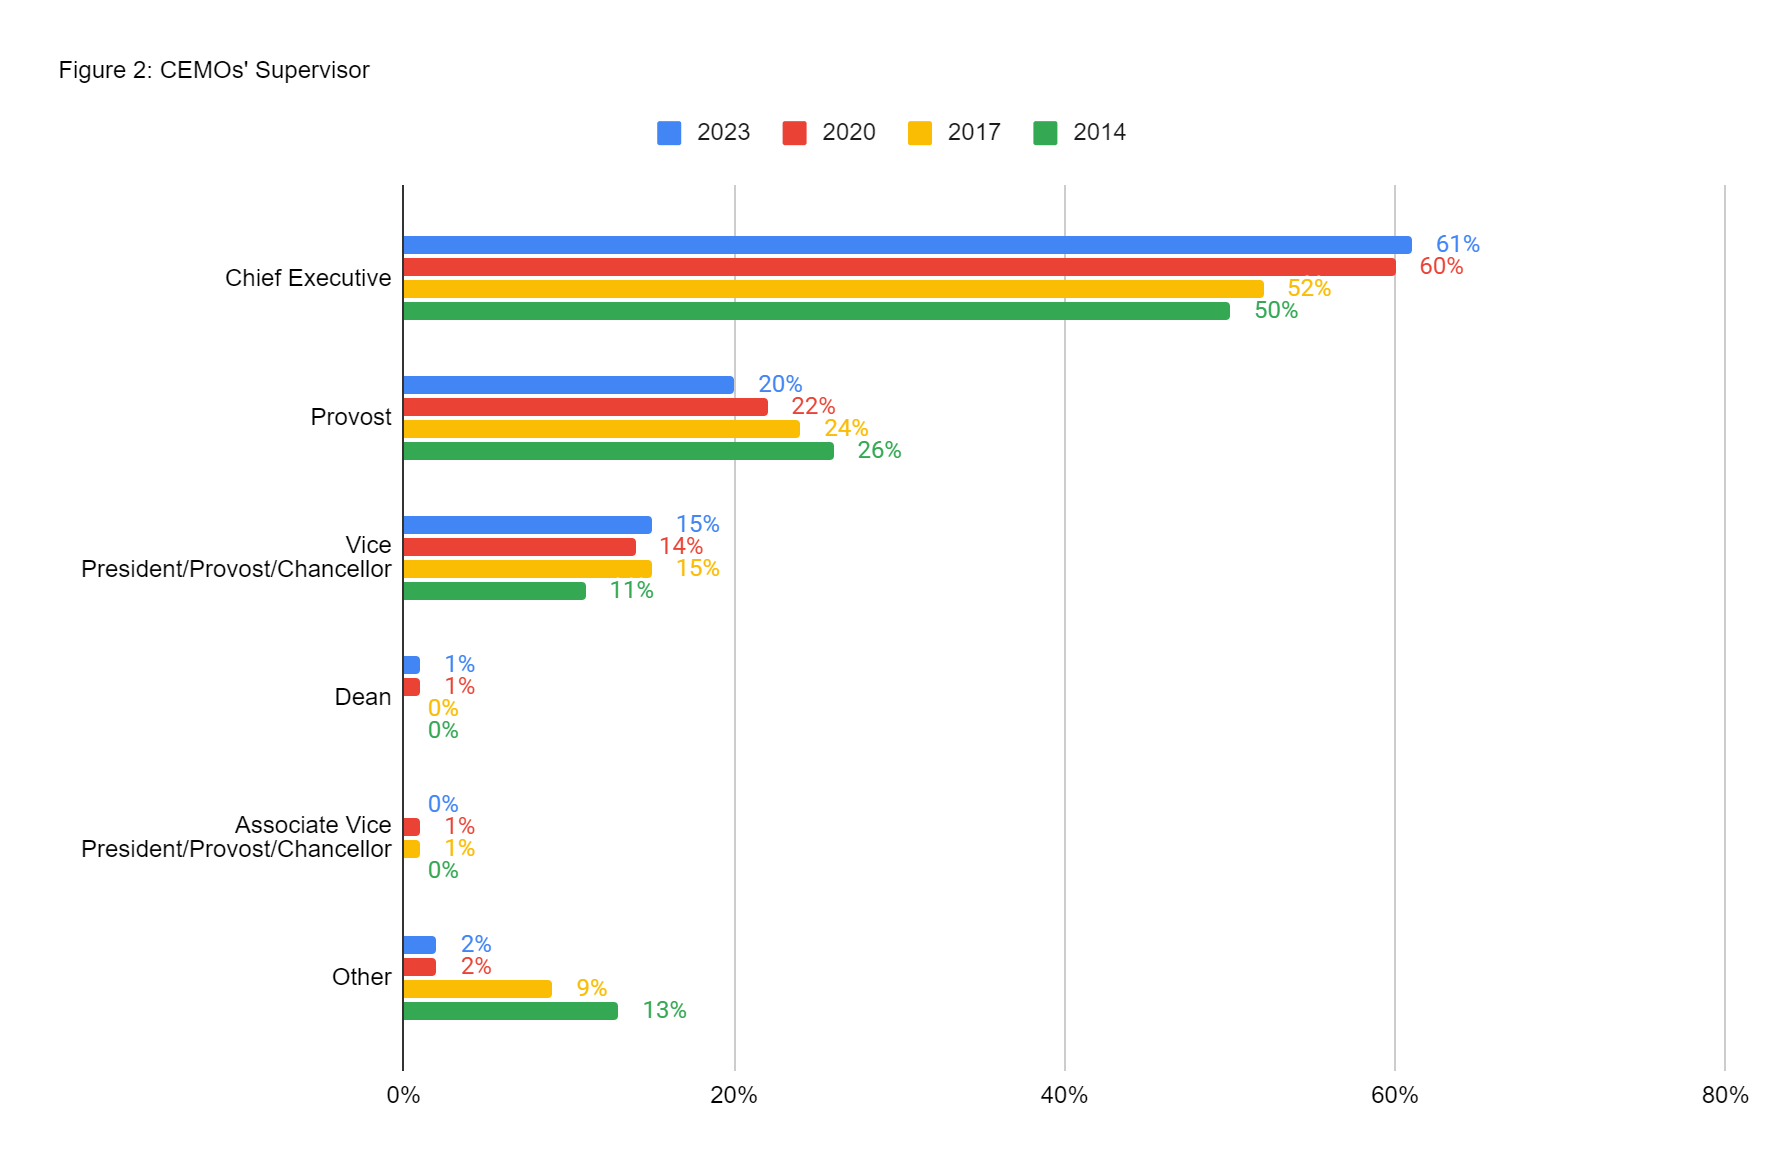
to report to different supervisors in different institutions
-
varied organizational placement
-
substantial experience in higher education and advanced education
-
many demands and responsibilities
Prospective CEMOs may need to embrace geographic and position mobility in their career path. There is a lack of demographic diversity within the current CEMO population.
We are also comparing previous CEMO data to current data. Figure 2 details the position that supervises the CEMO over the course of the four reports.
Figure 2
Transcript Withholding Regulation Webinar
The recent joint NACUBO and AACRAO webinar interpretation of the recent transcript withholding regulation is archived here. The slide deck is available here.
Current Higher-Education Research and Related Topics
OS Course Matcher Added to Open Syllabus
Open Syllabus is developing tools to assess course similarity and aid course-transfer decisions. The OS Course Matcher evaluates course similarity among 407 schools, including those in Texas. Its next tool will connect catalog predictions with Open Syllabus's 20-million-syllabi archive, enhancing course-equivalency assessment. These tools categorize similar courses, identify commonly taught classes and streamline course comparison. Open Syllabus supports various educational needs, including course transfers, Open Educational Resources (OER) programs, faculty evaluations and learning-outcomes analyses.
Study Using Chatbot Text-Message Data Examines Student Persistence
A study from EdSights analyzed nearly a million text messages between students and chatbots to develop insights on barriers to academic success. The study was announced in a webinar, and the full report will be released by EdSights in January, 2024. Key advice for institutions include:
-
begin text check-ins early to be most effective
-
create a sense of belonging because students feeling homesick are less likely to persist
-
teach a curriculum that is engaging and relevant to a student’s life experiences
-
focus on supporting students’ basic needs and wellness
Many Employees Believe Life Experience Is More Valuable than a Degree
New research from Go1 has found 46% of employees believe their university education failed to prepare them for their current job. The study surveyed over 3,000 employees across the United States, the United Kingdom and Australia on their attitudes about college as preparation for the workforce. The research also explored the perspectives of different generations, including Baby Boomers, Gen X, Millennials and Gen Z, and examined the challenges and opportunities employers face when training multigenerational teams.
Increases Seen in Undergraduate Enrollment
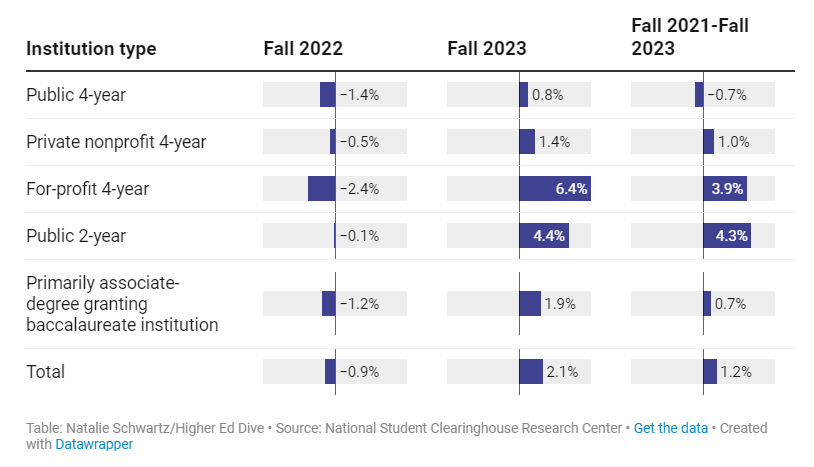
New data from the National Student Clearinghouse Research Center reveals undergraduate enrollment increased by 2.1% in fall 2023, marking the first increase since the pandemic. Community colleges accounted for over half of the increase, a significant reversal from the pandemic's initial losses.
The number of students pursuing associate degrees increased by 3.6%, while dual enrollment, in which high-school students receive college credit, has increased by 8.8%. However, fall 2023 showed a sharp decline in first-year enrollment, falling 3.6% year over year, nearly reversing gains from fall 2022. See Figure 3.
Figure 3: Undergraduate Enrollment By Institution Type and Year
Source: Schwartz, Natalie. “Undergraduate Enrollment Rises 2.1% This Fall, Preliminary Figures Show.” Higher Ed Dive, October 26, 2023. https://www.highereddive.com/news/undergraduate-enrollment-rises-fall-2023/697863/.
Multiple-Measures Assessment Shows Improved Student Success
In community colleges and other broad-access institutions, multiple-measures assessment (MMA) has become popular as a substitute for test-based methods for assigning entering students to developmental or college-level math and English courses. For example, in seven community colleges affiliated with the State University of New York, a recent study explores whether algorithmic MMA placement improved student results up to 45 months after randomization.
Approximately 13,000 new students were randomly placed using the algorithmic MMA approach or the status-quo method. Findings demonstrated MMA enhanced enrollment, and performance, in college-level courses. Lower English cut scores had more significant, enduring effects on finishing coursework at the college level. This report suggests MMA should be adopted and implemented at colleges, in conjunction with existing student-support programs.
Survey Explores How Colleges Are Perceived to Be Serving Students and Society
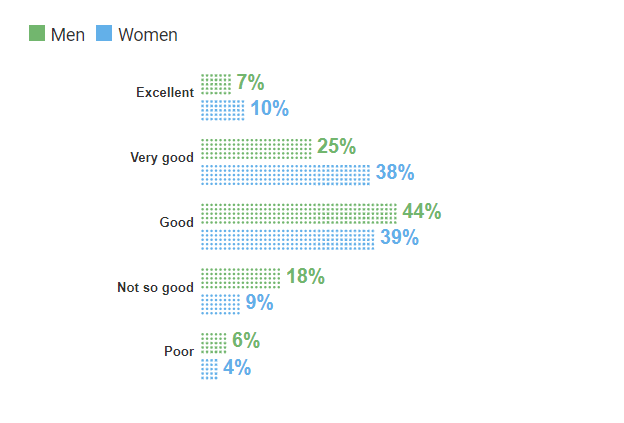
There continues to be wide diversity in Americans' perspectives on higher education. Views on higher education differ significantly between men and women (See Figure 4.), depending on the subgroup of those surveyed and the features of colleges being considered. A new interactive survey report allows readers to group respondents based on the category they were evaluating, or their response, and to filter based on five distinct demographic criteria, including Gender, Race, Education, Politics, and Income.
Figure 4: Overall, How Good A Job Do You Think Colleges Do Educating Their Students? (filtered by gender)
Source: Elias, Jacquelyn, and Brian O’Leary. “Where the Public Sees Value in Higher Ed.” https://www.chronicle.com/, November 6, 2023. https://www.chronicle.com/article/where-the-public-sees-value-in-higher-ed?sra=true.
New Data from U.S. Department of Education Examines Transfer Rates and Success
A new survey examines the effectiveness of the American postsecondary-education system in helping community-college students progress to bachelor's degrees. The report evaluated student transfer using National Student Loan Data System (NSLDS) data. In 2014, the transfer of 620,000 students was followed; these students attended community colleges from all 50 states and were eligible for Title IV aid. The study tracked these individuals for 8 years, documenting their successful transfer from community colleges and the degrees they earned from universities. Key points include the following.
-
About 13% of Title IV students who started at community colleges earned bachelor’s degrees within 8 years, but there was wide variation across different states.
-
Students performed well if their community college prepared them for transfer to the 4-year institution, and if those institutions were adept in enrolling and graduating them.
-
Pairs of 2-year and 4-year institutions benefitted if they both had strong transfer policies, such as common course numbering systems or articulation agreements.
High-School Students’ College Choice Influenced by Cost and Student Experience
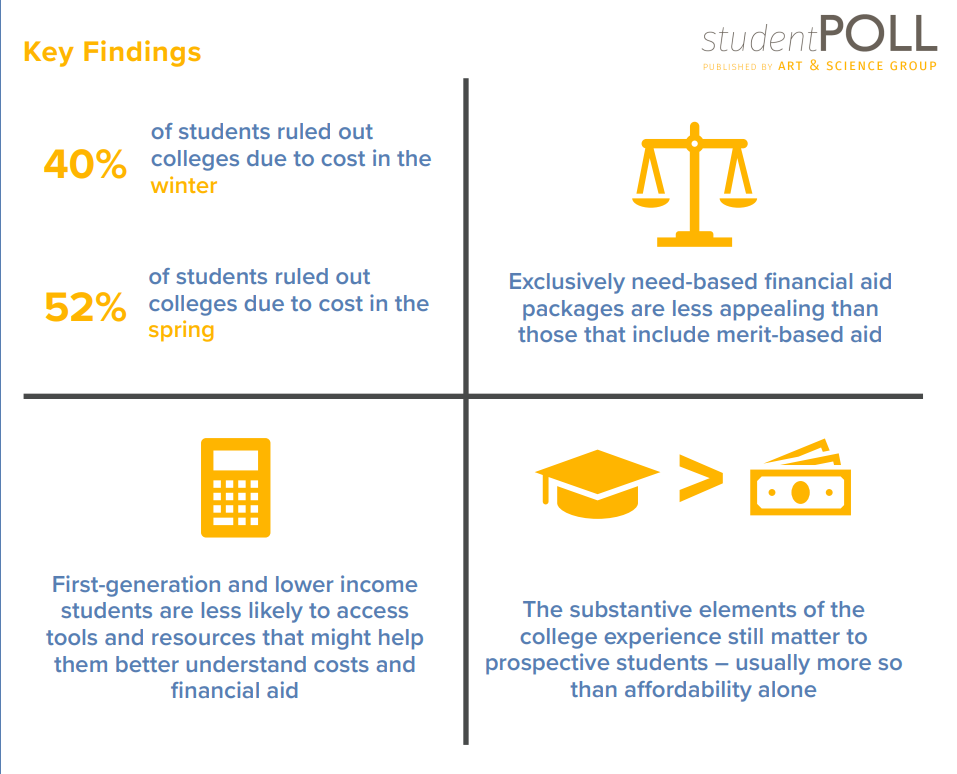
A recent survey of high-school seniors enrolled in 4-year institutions found that cost remains a significant factor for potential students when choosing a college. See Figure 5. A large percentage of potential students reject schools and universities due to price alone.
The Free Application for Federal Student Aid (FAFSA) is filled out by many potential students, but not many of them use available tools to understand costs and financial-aid procedures. Financial-assistance offers based solely on need are often less desirable than those that combine merit and need-based rewards. The influence of cost on the perceived appeal of one college or university over another can vary greatly, especially when one considers other aspects of the student experience.
Figure 5: Key Findings
Source: Art & Science Group. “StudentPOLL: Volume 16 | Issue 4 | Art & Science Group,” n.d. https://www.artsci.com/studentpoll-volume-16-issue-4.
Study of Extracurricular Activities Reveals Race, Gender and Financial Inequities
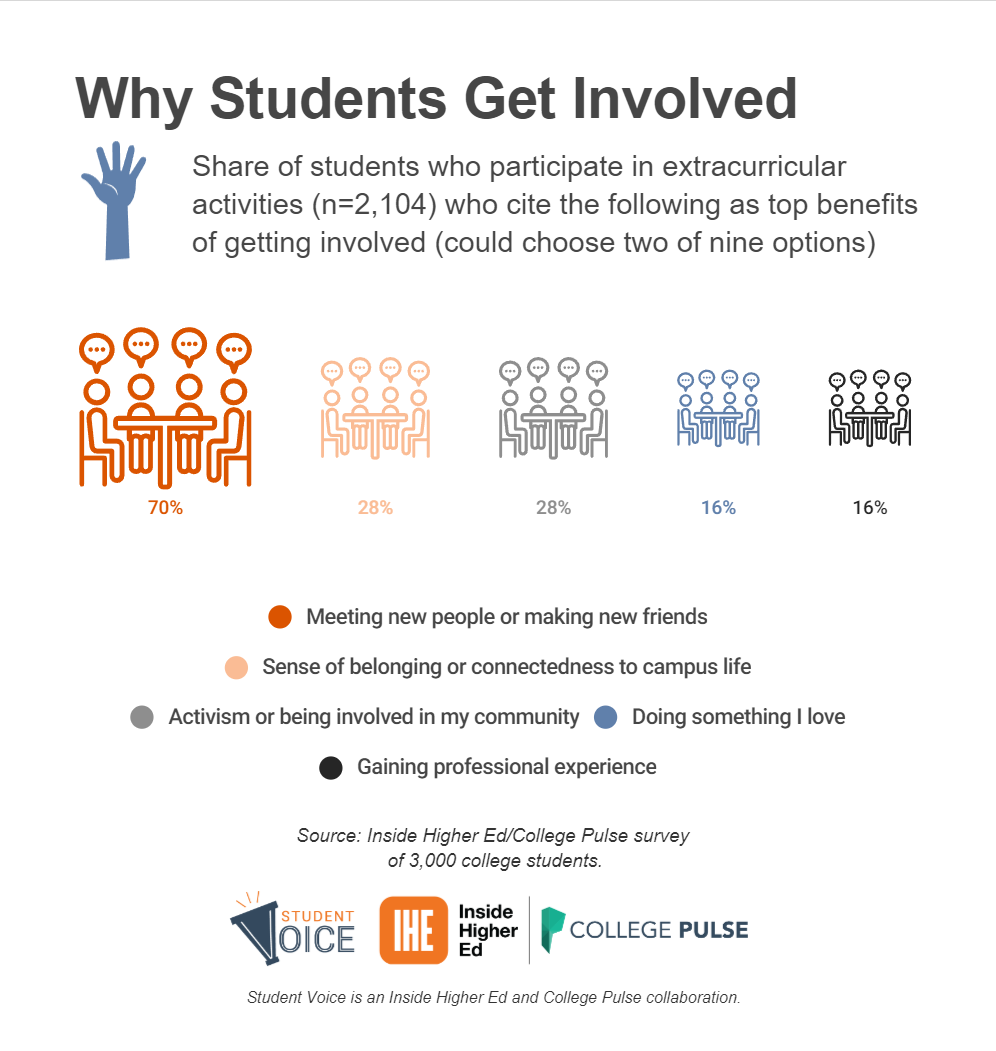
The Student Voice survey, conducted by College Pulse and Inside Higher Ed, asked 3,000 college students about their campus experiences and involvement in extracurricular activities. See Figure 6. Half of the students surveyed said they dedicate 1 to 5 hours a week to extracurricular activities, while only 14% dedicated 6 to 10 hours and 7% more than 10 hours. Nearly 30% of respondents did not dedicate any time to extracurricular activities. Key points include:
-
33% of women say they spend no time on extracurriculars, while 25% of men and 20% of nonbinary students spend no time on extracurricular activities
-
31% of students with financial aid spend zero hours per week on extracurriculars, versus 25% of students without financial aid
-
29% of White and 29% of Black students say they spend zero hours weekly on extracurricular activities, versus 16% of Asian students
-
40% of Hispanic students spend zero hours weekly on extracurricular activities
-
32% of Hispanic students report they work full-time, compared to 22% for the entire survey group
Figure 6: Why Students Get Involved
Source: Flaherty, Colleen. “Survey: Barriers to College Students’ Campus Engagement.” Inside Higher Ed | Higher Education News, Events and Jobs, September 22, 2023. https://www.insidehighered.com/news/student-success/college-experience/2023/09/22/survey-barriers-college-students-campus.