

As institutions face limited funding, resource constraints, and heightened student expectations, institutional data have become a strategic asset for improving operational efficiency and student success (Pelc 2024). In this context, the “data revolution” is less about collecting more information and more about using the right information to drive action (Busteed 2016). Increased accountability since the early 2000s has accelerated the use of analytics to monitor re-enrollment, academic performance, and other indicators tied to retention and completion (Burrell 2017, para. 4).
Longitudinal and cohort-based survey approaches are especially useful for examining change over time, evaluating interventions, and monitoring student pathways (Jenkins and Cho 2012). Repeated cross-sectional designs, in particular, enable institutions to track population-level trends using a stable instrument when individual-level tracking is impractical, often at lower cost and with strong representativeness across changing cohorts (Du and Kamakura 2015, 94).
This study examines the implementation of a repeated cross-sectional survey model at one private four-year research university, using its Fall Check-In Survey to assess participation, persistence intentions, academic and personal challenges, campus engagement, and course registration experiences. It illustrates how consistently collected student voice data can be translated into actionable insight for SEM planning and institutional decision-making. In addition, this study positions a repeated cross-sectional survey design as a pragmatic form of institutional learning within strategic enrollment management.
Institutional Context: Early Survey Efforts at the Institution (2016–2021)
The institution’s strategic enrollment management (SEM) approach is led by its Division of Enrollment and Student Success, which partners across the university to align enrollment strategy with student success outcomes. SEM leaders in this division integrate research and student services to align enrollment strategy with institutional mission and student outcomes. Through this work, the division supports the institution’s aspiration to be recognized among the Top 50 national research universities.
From 2016 to 2021, the institution conducted a series of recurring “check-in” surveys that captured some students’ experiences and provided snapshots, but without all the elements necessary for longitudinal studies. Unlike other surveys, the check-in survey is designed to provide a quick snapshot of how people are feeling and isn’t intended to delve deeply (Cook n.d.). Variations in survey time, length, audience, and branding limited the institution’s ability to compare and systematically evaluate outcomes across cohort surveys.
The lack of consistency across survey administrations included, but was not limited to, the issues noted below.
- Cadence: The survey fielding window varied from year to year.
- Instrument Length: The number of questions fluctuated substantially—one administration included 49 questions, while others had as few as sixteen.
- Branding: The survey title and framing changed each year (e.g., Temperature Check, Connections Survey), which may have affected recognition and continuity.
While the “pulse check” format generated valuable feedback, it limited consistent comparison and trend analysis over time.
The following sections cite relevant longitudinal studies, outline the method, highlight the findings, and provide interpretations through a strategic enrollment management lens. In closing, this paper highlights how student voice—captured through longitudinal survey data—can inform both immediate action and longer-term institutional learning, including a shift from reactive support models toward more predictive student success strategies.
Literature Review
A frequently cited example of cohort-based longitudinal enrollment research is Bowen and Bok’s (1998) The Shape of the River. Using the College and Beyond Database from 28 highly selective institutions, the authors examined long-term outcomes for two entering cohorts (1976 and 1989), including academic performance, graduation, post-college outcomes, and civic engagement. Analyses focused primarily on Black and white students due to limited sample sizes for other groups, illustrating how longitudinal cohort designs can assess outcomes over time.
A well-known example of a repeated cross-sectional survey is the British Social Attitudes Survey (BSA), conducted in most years since 1983 (Rafferty 2015). The BSA measures public attitudes on a range of topics related to Britain and governance. Each administration draws a new sample while retaining core questions across time, enabling population-level trend analysis without tracking the same individuals longitudinally.
In contrast, retrospective designs rely on existing records to reconstruct past experiences and outcomes. For example, Lowe, et al. (2020) examined clinical concerns and psychiatric diagnoses among college students referred from a campus counseling clinic through a retrospective chart review. Together, these approaches highlight the range of methodological strategies available for examining change over time, each with distinct trade-offs related to cost, feasibility, and analytic precision.
Building on these methodological foundations, this study is also grounded in a broader body of literature linking student voice, engagement, and persistence. Prior research demonstrates that students’ sense of belonging, academic confidence, and institutional connection are strongly associated with retention outcomes (Kuh, et al. 2006). Within strategic enrollment management (SEM), these constructs are increasingly operationalized through early-alert systems and predictive analytics to inform proactive intervention strategies.
Foundational theories of student persistence further emphasize the importance of integration into the academic and social life of the institution. Vincent Tinto described student persistence as shaped by an “intricate web of reciprocal relationships” that bind students to the institution (Felten and Lambert 2020, 28). Notably, while a significant proportion of students do not complete their degrees, relatively few leave due to academic dismissal; instead, departure is more often associated with challenges related to fit, belonging, and integration (Kuh, et al. 2006).
This perspective is further supported by developmental frameworks in student affairs, which emphasize the role of institutional environments in shaping student growth. Knefelkamp, Widick, and Parker(1978) argued for a theoretical foundation that explains how students develop intellectually, socially, and ethically during college, and how institutional structures can intentionally support that development. Together, these perspectives reinforce the importance of systematically capturing and responding to student experience data as part of a broader strategy to support student success.
This study extends this body of work by demonstrating how a repeated cross-sectional survey design can serve not only as a measurement tool but also as a practical mechanism for integrating student voice into ongoing SEM decision-making related to persistence and success.
Types of Longitudinal and Cohort-Based Survey Designs
Longitudinal and cohort-based research can take several forms, each with distinct strengths and limitations. Common approaches include: (a) prospective cohort studies, which follow the same individuals over time to examine change and outcomes; (b) repeated cross-sectional studies, which survey different samples from the same population at multiple points using a consistent instrument to assess population-level trends; and (c) retrospective studies, which use previously collected data to reconstruct past experiences and outcomes (Yee and Niemeier 1996). Both longitudinal and repeated cross-sectional designs support trend monitoring, intervention assessment, and evidence-based decision-making (Statsig 2024, para. 5). While longitudinal designs capture individual-level change, repeated cross-sectional approaches are often a more practical and efficient strategy for monitoring population-level trends when following the same individuals is not feasible (Statsig 2024, para. 4).
Problem Statement
Between 2016 and 2022, the institution administered multiple student feedback surveys that yielded valuable year-specific insights. However, variation in survey instruments across administrations limited the institution’s ability to conduct meaningful multi-year trend analyses. Without consistent constructs and aligned items, results could not be systematically compared across cohorts, making it difficult to distinguish real shifts in student experience from differences in survey design.
This lack of longitudinal comparability constrained the institution’s ability to evaluate the impact of student success initiatives, prioritize interventions, and integrate student voice data into strategic enrollment planning. To move from annual snapshots to actionable trend intelligence, the institution required a standardized, repeatable survey framework capable of producing comparable cohort-level insights over time.
Study Purpose
The purpose of this study was to examine the institution’s implementation of a repeated cross-sectional survey model administered each fall from 2022 through 2025 using a stable instrument. Specifically, the study evaluates whether this approach produces stable, year-over-year comparable data and generates interpretable cohort-level patterns that can be operationalized within strategic enrollment management (SEM) planning, student success strategy, and institutional decision-making processes.
Primary Research Questions
- RQ1: To what extent does a repeated cross-sectional survey design produce stable and comparable multi-year trend data suitable for SEM planning?
- RQ2: What cohort-level patterns and year-over-year shifts emerge across Fall 2022–Fall 2025 administrations?
Methodology
Research Design
Beginning in Fall 2022, the institution implemented a repeated cross-sectional survey design using a stable core instrument administered annually during the same October window (2022–2025). When leadership transitioned in 2023, the institution made a deliberate decision to retain the 2022 instrument rather than redesign it, thereby preserving item alignment and construct stability.
This approach was intended to:
- Enable consistent year-over-year evaluation;
- Identify cohort-level patterns; and
- Generate early indicators for proactive student success planning.
By maintaining a stable core set of questions, the institution sought to convert annual survey snapshots into comparable multi-year trend data suitable for strategic enrollment management (SEM) planning.
Participants and Sampling
The target population included all first-year undergraduate students enrolled during each fall term (2022–2025). In the first week of October each year, Enrollment Management compiled distribution lists based on active enrollment records. These lists served as the sampling frame for all outreach communications. Because the survey was administered to the full first-year cohort annually, the design captures cohort-level perspectives without tracking individual students longitudinally.
Recruitment and Communication Strategy
To maximize participation and reduce nonresponse bias, the institution implemented a structured, multi-modal contact strategy grounded in survey best practices. The outreach plan was finalized each year during the first week of October and included coordinated messaging across multiple channels. Students received up to six contacts over the data collection period (see Table 1).
| Phase | Contact Type | Purpose |
|---|---|---|
| Pre-Launch | Prenotification Email | Awareness and expectation setting |
| Launch | Initial Survey Email | Survey launch |
| Active Collection | Reminder Email (Non-responders) |
Nudge during break |
| Active Collection | Text Message Reminder | Increase visibility via an alternate channel |
| Final Push | Final Email Reminder | Final non-responder outreach |
| Final Push | Final Text Reminder | Last participation opportunity |
Additional reinforcement strategies included:
- Announcements in the First-Year Experience course for new students;
- Stakeholder awareness emails to advising, Financial Aid, Student Success, and academic support offices;
- Flyer distribution and unit-level encouragement; and
- Strategic reminder timing during and immediately following Fall Break to mitigate anticipated participation decline.
As an incentive, respondents were entered into a drawing in which 25 students received $10 in on-campus dining dollars. Incentives were intentionally aligned with institutional resources to reinforce campus integration and ease of redemption.
Data Collection Period
Across all four administrations (2022–2025), the survey opened and closed during the same October window to preserve comparability across cohorts. Following each administration, response files were archived, cleaned, and prepared for analysis within 24 hours of survey closure.
Response Rates
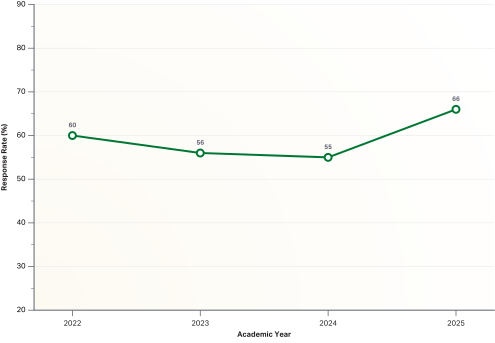
Response rates ranged from 55 percent to 66 percent across administrations (see Figure 1).
(Figure 1)
These rates substantially exceed typical online survey benchmarks, which often approximate 30 percent (Siegle n.d.), thereby reducing the likelihood of significant nonresponse bias and strengthening confidence in cohort-level interpretations.
The transition from national retailer gift cards to institution-specific dining dollars may have contributed to sustained engagement due to stronger campus relevance.
Instrument
The Fall Check-In Survey includes a stable core set of items designed to capture key dimensions of the undergraduate experience, listed below:
- Personal wellbeing
- Academic confidence and coursework perception
- Social belonging and peer connection
- Academic advising engagement
- Enrollment intentions
Representative items include the questions below:
- “How do you gauge your personal health and sense of wellbeing?”
- “What statement best describes your thoughts about your coursework?”
- “Have you been able to make friends or connect with other students at the institution?”
- “Which best describes academic advising at the institution?”
- “How accessible were your advisors?”
- “What are your enrollment plans for next spring?”
Maintaining consistent wording across administrations enabled reliable multi-year comparison and trend analysis.
Data Preparation
Following each administration, responses were reviewed for completeness and validity. Partial responses were retained when they included analyzable data relevant to the study’s research questions. Cleaned datasets served as the basis for descriptive and comparative trend analyses across cohorts.
Data Analysis
Annual survey response files were analyzed by the senior data analyst in the institution’s Division of Enrollment and Student Success, using SPSS. Descriptive statistics were calculated for each survey item by year, and results were summarized in annual reports with executive summaries and item-level findings.
For this study, findings from the 2022–2025 administrations were aggregated to generate a four-year comparative dataset. Year-over-year differences were examined using percentage-point changes to identify cohort-level shifts across administrations.
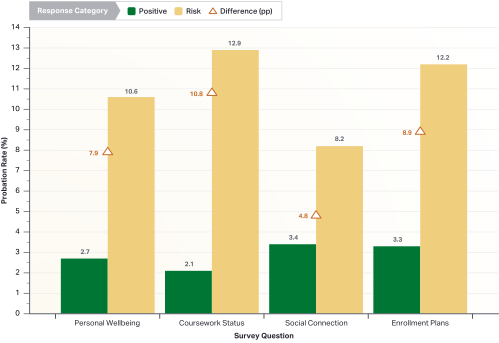
To assess the survey’s value as an early-alert tool, analyses were conducted to examine the relationship between students’ responses to selected risk-indicator items and subsequent academic outcomes. Differences across response groups were evaluated using probation rates, effect size ratios, and percentage-point differences.
Early-Alert Validation: Method
Following the Fall 2024 administration, survey responses from first-year students were matched with subsequent academic standing records to examine whether selected risk-indicator items were associated with probation status. Risk-indicator responses (e.g., reporting academic overwhelm or significant personal challenges) were compared to more positive response categories for the same items. The analysis focused on identifying differences in next-term probation rates between groups. Probation status was defined using the institution’s standard academic standing designation at the end of the subsequent term.
Early-Alert Validation: Results
Students who selected risk-indicator responses experienced probation rates three to six times higher than students who selected positive responses. Figure 2 displays probation rates for positive (green) and risk (red) response categories, with percentage-point gaps noted for clarity.
(Figure 2)
This figure demonstrates that students who report challenges in personal well-being, coursework, social connection, or enrollment plans are at substantially higher risk of academic probation. Across all four indicators, probation rates for at-risk responses are three to six times higher than for their peers. These results reinforce the value of early-term survey data as an actionable tool for identifying and supporting students before academic outcomes decline.
These results demonstrate that early-term student perceptions are not merely descriptive but are strongly associated with subsequent academic outcomes. The magnitude and consistency of these differences suggest that selected survey items can function as reliable early indicators of academic risk. As such, the Fall Check-In Survey provides a practical foundation for proactive, data-informed intervention within SEM practice.
Findings (Fall 2022–Fall 2025)
Analysis of four consecutive fall administrations (2022–2025) revealed consistent response strength and year-over-year differences across several key student experience indicators.
Response Stability
Response rates ranged from 55 percent to 66 percent. After an initial rate of 60 percent in Fall 2022, participation dipped slightly in 2023 (56 percent) and 2024 (55 percent) before rising to a four-year high of 66 percent in 2025. Importantly, response rates remained well above typical online survey benchmarks (often around 30 percent), strengthening confidence in the representativeness and stability of the findings. The rebound in 2025 also suggests that refinements to outreach strategies and incentive structures may have contributed to increased student engagement.
Retention Intent
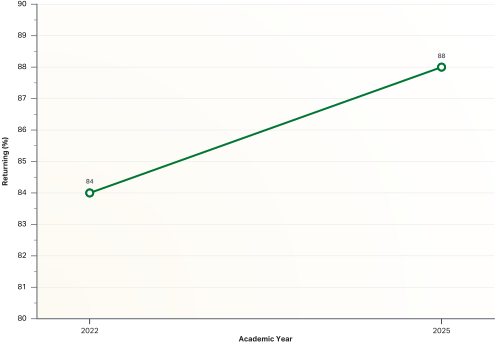
The proportion of students indicating they were “definitely returning” increased from 84 percent in 2022 to 88 percent in 2025, reflecting a modest but meaningful upward trend in student confidence and commitment. While overall intent to persist remains high across all cohorts, the increase in “definite” intent suggests strengthening institutional connection and clarity of academic direction. For SEM practice, this distinction is important, as stronger intent signals are more likely to translate into actual enrollment behavior.
(Figure 3)
Campus Engagement
Student engagement increased across all measured categories between 2022 and 2025, with particularly notable gains in student organization participation and extracurricular involvement. These trends suggest that recent cohorts are becoming more actively integrated into campus life, a factor consistently associated with persistence and student success. From an SEM perspective, rising engagement underscores the importance of early, accessible involvement opportunities as a lever for strengthening belonging and retention.
- Participation in student organizations increased from 47 percent to 74 percent.
- Involvement in extracurricular activities rose from 62 percent to 81 percent.
- Attendance at campus events increased from 53 percent to 61 percent.
Registration Experience
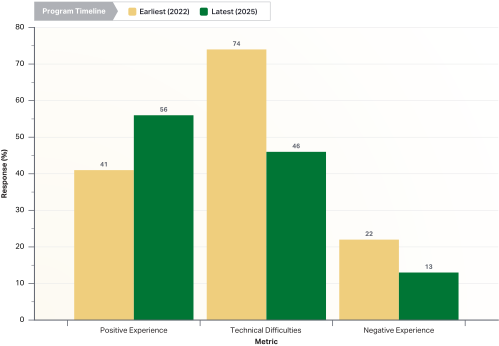
Positive registration experiences increased from 41 percent in 2022 to 56 percent in 2025, while reports of technical difficulties declined substantially. These shifts indicate meaningful improvement in a critical early academic process that directly affects students’ ability to establish momentum. From an SEM standpoint, reducing operational friction in registration is not merely a service enhancement but a strategic intervention that supports credit progression and persistence.
(Figure 4)
Summary of Trends
Across multiple indicators—including retention intent, engagement, and registration experience—results from 2022 to 2025 show year-over-year variation and cohort-level shifts. The repeated cross-sectional design supports consistent comparisons across administrations and provides institution-level visibility into multi-year patterns not available from single-year survey results.
Potential Confounding Factors
When interpreting survey results, several sampling and participation dynamics should be considered, as they may influence the stability and generalizability of the findings.
First, respondent representation is uneven across schools. Students from the Arts and Sciences college comprise 54 percent of respondents, indicating that overall results are disproportionately influenced by this population’s experience. While this provides a strong picture of the university’s largest undergraduate population, it may mask patterns unique to smaller schools.
Second, some schools have relatively small sample sizes. For example, the public health college has the smallest overall participation (195 total responses, including only 45 in 2023). As a result, year-to-year percentage changes for this college may appear large even when driven by relatively small numerical differences, reducing statistical stability. Similarly, the engineering school’s sample declined, before rebounding in 2025, suggesting that improvements within this group should be interpreted cautiously.
Third, total survey participation declined by approximately 16 percent between 2022 and 2024 (1,768 to 1,478 respondents). Such variation in response volume can influence trend comparisons and may affect the comparability of results across administrations. When examined together, these factors do not invalidate the findings but suggest that conclusions should be interpreted primarily as institution-level directional indicators rather than precise estimates for each individual school. Continued monitoring of participation balance and response rates will help strengthen the reliability of future analyses.
Interpretations of Findings
The four administrations analyzed here (2022–2025) occurred during a period of institutional re-stabilization following COVID-era disruption, providing a useful context for interpreting cohort-level shifts in engagement, well-being, and academic processes.
Student Commitment: A Strong Intent to Persist
Over the past four years, 99 percent of first-year student respondents said they would “definitely” or “probably” return for the next semester, indicating their intent to persist is extremely strong. Confidence was also noted when students said they were “definitely returning.” In Fall 2022, this was 84 percent and increased to 88 percent in Fall 2025.
The near-universal intent to return represents a substantial first-year retention strength for the institution. Although stated intent does not always translate into actual enrollment, the institution’s observed first-to-second-year retention rates are in the low-90 percent range for recent cohorts. These rates remain well above national benchmarks; the National Student Clearinghouse Research Center’s Persistence and Retention reports estimate that the average first-year retention rate for four-year institutions is around 70 percent (National Student Clearinghouse Research Center 2023).
Survey results demonstrate an increase in the proportion of students reporting they are “definitely returning.” Complementary insights from Residential Life “Chats”—a qualitative check-in survey of residential students—further contextualize this trend.
In particular, first-year residential students report high enthusiasm and a strong interest in engaging with campus life, with community most often anchored in the residence halls and student organizations. Their feedback suggests that roommate relationships are generally positive and that facilities concerns are typically minor (e.g., bathrooms or A/C) rather than persistent disruptions.
Well-being themes largely reflect common transition challenges—especially homesickness and time management—rather than indicators of widespread distress. Taken together, these quantitative and qualitative patterns are consistent with growing student confidence and a residential experience consistent with belonging and persistence, while recognizing that the findings reflect associations rather than causal effects. Collectively, these results also reinforce a broader shift in institutional priorities—from simply tracking whether students return to strengthening the supports that help students thrive throughout their degree and beyond.
Academic and Personal Challenges: Declines Over Time
Longitudinal results from the institution’s Fall Check-In Survey suggest a promising reduction in both academic and personal strain among new undergraduate students. Between 2022 and 2025, the share of students reporting that they felt academically overwhelmed declined by seven percentage points (from 30 percent to 23 percent). Over the same period, the percentage reporting major personal challenges (e.g., health, family, financial concerns) decreased from 9 percent to 6 percent.
Together, these shifts suggest recent cohorts may be navigating the transition to college with somewhat less distress, coinciding with expanded institutional supports (e.g., enhanced academic support, refinements to first-year advising, and strengthened counseling/peer support). This interpretation aligns with national evidence from the 2024–2025 Healthy Minds Study (84,000+ students at 135 institutions), which reports a third consecutive year of improvement: severe depression declined to 18 percent in 2025 (down from 23 percent in 2022) and suicidal ideation fell to 11 percent (down from 15 percent in 2022).
Even with these encouraging trends, the need for targeted intervention remains clear: roughly one-quarter of first-year students still report academic overwhelm, and a meaningful share continue to experience significant personal difficulties. A longitudinal analytic approach will enable the institution to test whether reductions in student distress are associated with improved retention, persistence, and academic momentum over time.
Campus Engagement: Rising Sense of Connection
Over the four-year survey period, rising student engagement suggests a strengthening connection to the institution’s community. From 2022 to 2025, self-reported first-year participation in student organizations increased from 47 percent to 74 percent, involvement in other extracurricular activities grew from 62 percent to 81 percent, and attendance at campus events rose from 53 percent to 61 percent.
These patterns suggest that recent cohorts are intentionally seeking opportunities to build social networks and institutional relationships. Changes during this period included strengthened first-year programming, more intentional communication with student organizations, enhancements to living-learning communities, and expanded opportunities for student involvement.
A March 2025 Student Experience in the Research University (SERU) Consortium report found that although student engagement across several domains has increased since 2020, participation in many activities has not yet fully returned to 2019 levels (Mowreader 2025, para. 2).
In the article Data: Students Less Involved on Campus Post-Pandemic, SERU Consortium Director and Senior Researcher Igor Chirikov emphasized that “The pandemic brought great disruption to [engagement]…and the narrative around is that, “Oh, things are back to normal. We’re operating normally.” And it looks like, you know, on campuses, the pandemic has been forgotten…but in the data, in fact, we don’t see that” (Mowreader 2025, para. 3).
This matters because, as students continue to come to campus with psychological challenges, strategies must be put in place to prevent debilitating effects on one’s academic performance and social adjustment so they can be retained and complete their degree (Kuh, et al. 2006).
Overall, the increased engagement reported by the institution’s first-year students points to a growing sense of belonging early in the college experience. Targeted outreach—particularly to first-generation students—through pre-arrival programming, living-learning communities, cross-campus partnerships, and peer mentorship structures—may be contributing to these results. Continued monitoring will be important to ensure these gains are sustained and equitably distributed across student populations, strengthening retention, campus climate, and long-term alumni connections.
Course Registration: Significant Improvements in Experience
One of the most notable improvements over time was students’ experience with course registration. In 2022, only 41 percent of first-year students reported a positive enrollment/registration experience. By 2025, that figure rose to 56 percent, indicating that a majority experienced a smoother process. Reported technical issues declined substantially—from 74 percent in 2022 to 46 percent in 2025—and overall negative experiences decreased from 22 percent to 13 percent. The frequently cited challenge of “difficulty getting into desired classes” also improved, declining from 71 percent in 2024 to 63 percent in 2025.
These shifts coincided with policy refinements and technological adjustments designed to streamline registration, including expanded coaching and success workshops, targeted outreach informed by faculty feedback, cross-unit coordination among academic and student support offices, and enhanced reporting to support proactive intervention. Several schools also strengthened first-year programming and peer support structures to improve early academic navigation.
Registration represents one of a student’s earliest and most consequential institutional interactions. When that experience is difficult, it can delay access to required coursework, slow credit accumulation, and disrupt early academic progress—factors closely tied to persistence and completion (Adelman 1999). Research on academic momentum demonstrates that the pace and structure of early course-taking exert an independent influence on degree attainment, beyond background characteristics (Attewell, et al. 2012). Students who progress steadily are more likely to complete, while those who encounter early disruption are at greater risk of delay or attrition.
Viewed through this lens, improvements in the registration experience extend beyond satisfaction metrics. Reducing procedural friction helps protect early academic momentum, reinforcing confidence and supporting steady credit progression. The substantial decline in reported technical issues suggests meaningful operational progress in an area directly connected to first-year persistence trajectories.
Broader Implications and Trends
The institution’s longitudinal findings reflect wider trends in higher education and suggest future policy directions. Most clearly demonstrated is the movement to more proactive, data-informed student success initiatives across various divisions on campus.
As campus life has stabilized at the institution, engagement has increased and reported stress has declined—suggesting that many students are rebuilding community, strengthening connections, and regaining a sense of equilibrium.
At the same time, the institution’s results underscore a broader reality: the recovery period following COVID-19 disruption is not uniform across institutions. Many campuses continue to report persistent disengagement and uneven rebounds in student involvement, and national patterns of student engagement at U.S. public universities show notable disparities by gender, race/ethnicity, and socioeconomic background (Chirikov, et al. 2025, 4). These contrasts raise practical policy questions, including:
- What has the institution done differently to support re-engagement and student well-being?
- Which strategies appear transferable, and how might other institutions adapt effective models to re-engage students?
Alternatively, the institution’s improvements in registration highlight how easily policy conversations can overlook the operational components of academic processes. Issues such as course availability, advising holds, and registration logistics during orientation may not be the most visible or frequently discussed topics, but they often have just as much impact on students’ ability to get started smoothly and maintain academic momentum as more prominent concerns, such as financial aid.
This also highlights areas where further improvement remains possible. For example, if difficulty accessing desired courses remains a concern for 63 percent of students in 2025, this represents a substantial proportion and suggests continued opportunities for institutional refinement.
Another important element of the institution’s positive internal trends is the use of context and benchmarking when interpreting institutional data. Trends can appear encouraging in isolation, but external comparison helps clarify the magnitude—and significance—of the improvement. For example, noting that the institution’s 66 percent survey response rate exceeds NSSE’s 2025 response rate of 51 percent (National Survey of Student Engagement, para. 6) strengthens confidence in the reliability of the institution’s findings and the representativeness of the results.
This also highlights areas where further improvement remains possible—for example, if getting classes was still a problem for 63 percent of students in 2025, that is still too high a number (and likely higher than some peer institutions with a greater number of open seats).
Lastly, the institution’s findings underscore a core lesson in institutional research: meaningful change often requires time. The shifts observed from 2022 to 2025—whether a fifteen-point rise in positive registration experiences or increased participation and engagement—are likely best understood as the cumulative, delayed payoff of sustained, year-over-year initiatives rather than the result of any single intervention. In this way, the institution’s trajectory reflects how evidence-based practices develop over time through systematic, efficient institutional processes that incorporate feedback on both processes and outcomes to drive continuous improvement (Kezar 2010).
Implications for SEM Practice
Across the 2022–2025 survey administrations, findings were not only interpreted but actively used to inform institutional decision-making. Student-reported experiences were translated into targeted operational changes, illustrating how survey data can function as a practical tool for action within strategic enrollment management.
For example, early survey results indicating high levels of academic overwhelm led to the expansion of success coaching and targeted academic support outreach. In subsequent administrations, reported overwhelm declined, suggesting these interventions may have contributed to improved student adjustment. Similarly, persistent reports of registration challenges prompted coordinated changes across advising, IT systems, and orientation processes. Over time, these efforts corresponded with a substantial reduction in reported technical issues and improved student satisfaction with registration.
Taken together, these examples demonstrate how repeated cross-sectional survey data can serve as an operational feedback mechanism—informing both immediate interventions and longer-term SEM strategy. Building on this model, several practical implications arise for institutions seeking to strengthen SEM by leveraging structured student voice data.
- Prioritize instrument stability over constant reinvention. Maintaining a stable core instrument across administrations enables meaningful year-over-year comparison and reduces the risk of conflating measurement variation with true cohort-level change. Institutions seeking longitudinal insight should resist annual redesign and instead preserve comparability while refining selectively.
- Use early-term surveys as operational, not merely descriptive, tools. Administering the Fall Check-In Survey within a consistent October window creates an opportunity to surface early indicators—such as academic overwhelm or limited advising engagement—while there is still time to intervene. To maximize impact, survey findings should be tied to decision timelines, triage structures, and follow-up protocols rather than treated solely as assessment artifacts.
- Integrate survey findings with institutional outcome data. Linking selected survey responses to subsequent academic outcomes provides criterion-based evidence that certain items function as early-alert indicators. Institutions can strengthen the utility of survey tools by connecting perception-based measures with behavioral or academic outcomes to identify actionable risk signals.
- Elevate operational friction as a retention lever. Improvements in course registration experiences underscore the importance of addressing procedural barriers—such as technical issues, advising holds, and access to desired courses—that may disrupt academic momentum. SEM strategy should attend not only to financial aid and engagement initiatives, but also to the operational systems that shape students’ earliest institutional interactions.
- Interpret trends in context. Cohort-level shifts gain meaning when interpreted alongside response rates, subgroup representation, and external benchmarks. Monitoring participation stability and incorporating national comparison points can strengthen confidence in internal findings and support more informed resource allocation.
- Build a culture of disciplined, longitudinal learning. Repeated cross-sectional design offers a pragmatic alternative to full longitudinal tracking while still enabling institutions to observe patterns over time. When implemented consistently, this approach supports cumulative institutional learning—allowing leaders to assess whether policy adjustments, advising redesigns, or engagement strategies correspond with measurable shifts in student experience.
Collectively, these implications suggest that repeated cross-sectional surveys, when embedded within SEM planning structures, can move institutions from episodic feedback collection to sustained, data-informed strategy development.
Limitations
The findings should be interpreted in light of several limitations:
- Uneven representation across academic units. Response counts varied by school. For example, the school of public health produced the smallest annual respondent totals (approximately 45–82 per year). Small subgroup sizes reduce statistical power and increase the likelihood that year-to-year shifts reflect sampling variability rather than meaningful change; as a result, SPH-specific comparisons should be interpreted with caution.
- Voluntary, self-reported data. Because the survey was optional and perception-based, responses may be affected by recall error, social desirability, and differences in how students interpret survey items. Respondents may also differ systematically from non-respondents, which can introduce response bias.
- Variation in response rates over time. Response rates declined by 16.4 percent from 2022 to 2024, then rebounded in 2025. Lower participation years may increase the risk of nonresponse and selection bias if respondents are less representative of the overall student population, even with multi-channel outreach efforts.
- Correlational design. The analyses identify associations and do not support causal conclusions. Observed relationships should not be interpreted as evidence that one factor directly drives another.
Considered together, these limitations suggest the results are best viewed as descriptive trends in student perceptions over time, rather than definitive explanations of student behavior or outcomes.
Future Directions and Unanswered Research Questions
Building on these findings and institutional practices, this research has informed the development of a Student Voice–to–SEM Action Loop, which provides a structured, iterative framework for translating student feedback into institutional decision-making.
Core Feedback Loop1
- Collect Student Voice
- Fall Check-In Survey (October)
- Standardized instrument
- First-year cohort
- Identify Risk Signals and Trends
- Academic overwhelm
- Registration friction
- Advising engagement gaps
- Social connection indicators
- Analyze and Validate Findings
- Year-over-year comparisons
- Linkage to outcomes (e.g., probation rates)
- Identification of high-impact indicators
- Disseminate Insights Across Units
- Advising
- Student Success
- IT / Registration
- Academic leadership
- Implement Targeted Interventions
- Expanded coaching and workshops
- Registration process improvements
- Advising structure enhancements
- Engagement programming
- Monitor Outcomes
- Next-term academic standing
- Subsequent survey trends
- Engagement and retention indicators
This model illustrates how the Fall Check-In Survey functions as part of an iterative SEM feedback system. Early-term student perceptions—captured through a standardized survey—are analyzed, validated against outcomes, and translated into targeted interventions across academic and student support systems. These interventions, in turn, shape subsequent student experiences and outcomes, which are then re-measured in the next survey cycle, supporting continuous institutional improvement.
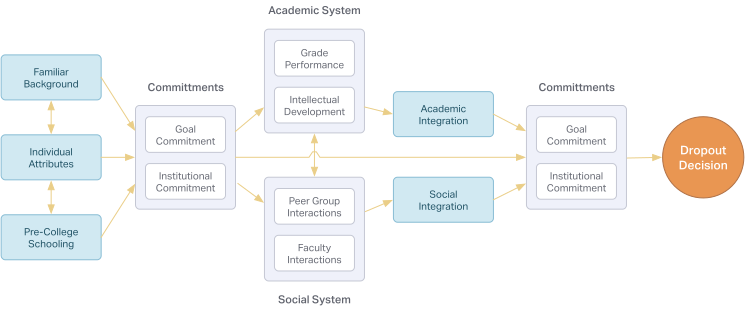
In addition, this model builds on foundational student persistence frameworks, particularly Vincent Tinto’s emphasis on academic and social integration, by incorporating a structured, data-informed feedback loop (see Appendix A). While Tinto’s model conceptualizes how student experiences influence persistence, the Student Voice–to–SEM Action Model extends this framework by operationalizing student feedback as a continuous input into institutional decision-making.
To further clarify how this model operates in practice, the process can be understood as a sequence of coordinated steps:
The Student Voice–to–SEM Action Model: Step-by-Step
The model operates as a continuous, structured cycle in which student feedback is translated into institutional action and reassessed over time. Each stage builds on the previous one, creating a coordinated process for identifying risk, implementing interventions, and evaluating impact.
- Collection captures early-term student perceptions through a standardized survey.
- Identification and analysis surface key risk signals and validate their relationship to academic outcomes.
- Dissemination ensures insights are shared across advising, student success, and academic leadership.
- Intervention translates findings into targeted operational and programmatic changes.
- Outcome monitoring evaluates the effectiveness of these interventions and informs subsequent cycles.
Taken together, this step-by-step process illustrates how student voice can be systematically embedded into SEM decision-making, shifting the model from passive assessment to an active, iterative approach to SEM strategy.
Conclusion: Committing to Longitudinal Insight
The institution’s experience underscores the value of a consistent, repeated cross-sectional approach, administering a stable instrument at a regular cadence to comparable cohorts. Even without tracking individual students over time, institutions can still produce rigorous trend analyses, detect year-over-year shifts, and translate student voice into timely, targeted interventions.
Looking ahead, the institution is exploring a redesign that breaks a longer student check-in instrument into three very short waves (approximately 60–120 seconds each), administered across an early-to-midterm window. The aim is to surface leading indicators sooner—to enable an earlier response without waiting for a full survey cycle to close.
Comparable approaches already exist in higher education, most notably the Beginning College Survey of Student Engagement Fall Check-In2—an initiative of the National Survey of Student Engagement—which offers three brief check-ins (September, October, and November). Each check-in is designed to take about one minute to complete and supports near-real-time reporting, with options for student-specific pathways to enable follow-up when students request assistance.
A “three quick pulses” approach could be both methodologically rigorous and operationally useful, provided it is anchored in clear decision points, triage-ready results, and a stable analytical core. Draft purpose statements aligned to action are outlined below.
- Pulse 1: Early adjustment and transition signals
- Pulse 2: Academic load, belonging, and help-seeking behavior
- Pulse 3: Return intention and registration/continuation friction
If the institution adopts this redesign, it would implement the approach consistently over multiple years and repeat the methodology in alignment with the repeated cross-sectional approach, preserving comparability and strengthening trend validity over time.
For other institutions—whether using a full-length survey or a micro-survey (pulse) model—the implications are practical and scalable. A repeated cross-sectional design reduces many of the barriers associated with longitudinal tracking while still yielding actionable cohort-level insights. It strengthens comparability across years, supports benchmarking, and builds an evidence base for assessing whether policy and practice changes—such as advising redesigns, expanded support services, or engagement initiatives—are associated with improved student outcomes.
The invitation to share the institution’s journey was accepted in the spirit of collegiality. The more institutions document applied, student-centered research, the stronger our collective learning becomes. Sharing approaches, measures, and lessons learned strengthens the field’s ability to understand what sustains engagement and academic momentum—and supports broader efforts to improve persistence and completion across diverse institutional contexts. In an era of volatility, institutions that discipline themselves to measure consistently—rather than endlessly— are best positioned to transform student voice into strategic action.
Appendix A
Vincent Tinto (1993) identified three major sources of student departure: academic difficulties, the inability to resolve their educational and occupational goals, and failure to become or remain incorporated in the intellectual and social life of the institution. Tinto’s “Model of Institutional Departure” (see Figure 5) states that students need integration into formal (academic performance) and informal (faculty/staff interactions) academic systems and formal (extracurricular activities) and informal (peer-group interactions) social systems to persist (Involve@State 2021).
(Figure 5)


share