

Small private four-year universities face increasing challenges in recruiting and enrolling first-time, full-time students, especially following the 2024 changes to the Free Application for Federal Student Aid (FAFSA) (National Association of Independent Colleges and Universities 2024). These changes disrupted the traditional admissions and financial aid timelines, making it more difficult for institutions to provide timely aid offers and for students to make informed decisions. Although the National Student Clearinghouse (2025) reported freshman enrollment growth between Fall 2023 and Fall 2024 across sectors, Meyer (2024) reported a 10.7 percent drop in first-year enrollment among four-year private institutions, particularly affecting Pell-eligible students.
These enrollment shocks come at a time when small, tuition-dependent colleges are already facing financial instability. In 2025 alone, multiple small colleges announced closures due to unsustainable revenue losses (Blake 2025; Prestininzi 2025). Given that tuition revenue is the primary funding stream for these institutions, effective enrollment management has become essential for financial sustainability (NCES 2023).
To support enrollment goals, colleges have increasingly turned to predictive analytics to anticipate which admitted students are most likely to enroll. Traditional predictive models, such as logistic regression, are widely used for their interpretability and ease of deployment. However, recent advances in machine learning suggest that more complex models may yield greater predictive accuracy. Prior research has applied machine learning techniques such as decision trees, ensemble methods, and regularized regression to improve yield prediction and better allocate outreach resources.
This study systematically compares four modeling techniques — logistic regression (LR), Lasso Regression (Lasso), Elastic Net (EN), and Random Forest (RF) — using a single dataset of admitted students from a small private university. The research evaluates predictive performance using standard metrics, including accuracy, precision, recall, F1 Score, and area under the curve (AUC). By assessing both linear and non-linear models under consistent conditions, the study provides insights for enrollment management and applied enrollment modeling.
Literature Review
Distinct Features of Machine Learning Techniques
Machine learning techniques differ in their modeling approaches, offering unique strengths and trade-offs. This section highlights the distinct features of the four commonly used methods mentioned above.
LR is widely used due to its simplicity and interpretability. However, it assumes a linear relationship between the predictors and the log-odds of the outcome (Abelt, et al. 2015; Basu, et al. 2019; Bird 2023; DesJardins Ahlburg, and McCall2006; Esquivel and Esquivel 2020). Using the logistic function, it models the probability that the binary outcome equals one and estimates coefficients via maximum likelihood (James, et al. 2023; Molnar 2025). These coefficients maximize the likelihood of the observed outcomes under the specified model.
To address overfitting and enhance generalization, regularized regression techniques such as Lasso and EN apply penalty terms to the model coefficients (James, et al. 2023; Tibshirani 1996; Zou and Hastie 2005). Such regression techniques employ L1 or L2 penalty terms in estimating coefficients. Ridge regression applies an L2 penalty that shrinks coefficients toward zero without eliminating any variables (Tay, Narasimhan, and Hastie et al. 2023; Zou and Hastie 2005). For example, in a model predicting student yield with highly corrected ACT subscores in English, mathematics, and reading, Ridge regression would preserve all predictors, even if they were highly correlated. In contrast, Lasso uses an L1 penalty that encourages sparsity by setting some coefficients exactly to zero (Tay, Narasimhan, and HastieTay, et al. 2023; Zou and Hastie 2005). This method effectively identifies the most impactful variables from a large pool of variables entered in the model. For instance, Lasso might eliminate distance from campus by setting its coefficient to zero while retaining other variables, yielding a parsimonious model. Finally, EN combines both penalties, with a mixing parameter determining the balance between them. This makes it particularly effective for groups of correlated predictors (Tay, Narasimhan, and Hastie Tay, et al. 2023; Zou and Hastie 2005). Returning to the ACT example, EN would likely retain the group of correlated subscores while simultaneously performing feature selection on other, less correlated predictors.
When relationships between predictors and the outcome are nonlinear, LR may underperform (Hastie, Tibshirani, and Friedman et al. 2009; James, et al. 2023). In such cases, tree-based methods offer an alternative. RF is capable of modeling nonlinear patterns and complex interactions.
Before describing RF, it is helpful to review some technical details of the decision tree technique. A decision tree is a supervised learning algorithm that partitions data into subsets based on feature values, producing a tree-like structure in which each internal node represents a decision rule, and each leaf node corresponds to an outcome. Decision trees are intuitive and interpretable, and they can handle both numerical and categorical data (Breiman, et al. 2017; James, et al. 2023). Splitting decisions are typically based on impurity measures such as entropy or the Gini index. Entropy, used in the ID3 algorithm, measures the uncertainty of a dataset and seeks splits that maximize information gain (Quinlan 1986). The Gini index, used in the Classification and Regression Tree (CART) algorithm, measures the probability of incorrect classification and aims to minimize this value with each split (Breiman, et al. 2017; James, et al. 2023; Molnar 2025; Shao, et al. 2022). Despite their flexibility, decision trees are prone to overfitting.
To overcome this limitation, Breiman (2001) introduced RF, an ensemble method that builds multiple decision trees using bootstrap samples and random feature selection at each split. The model aggregates the predictions of all trees—by majority vote for classification or averaging for regression—thereby improving predictive accuracy and reducing variance (Breiman 2001; James, et al. 2023). RF also retains some interpretability through tools such as variable importance plots and partial dependence plots, making it more accessible than other ensemble methods such as boosting or neural networks. For classification problems involving nonlinear relationships and high-dimensional data, RF is often a preferred choice (Breiman 2001; James, et al. 2023).
Performance
Comparative studies have produced mixed findings on the performance of different machine learning techniques. Basu, et al. (2019) found that LR outperformed other models—including decision trees, RF, and gradient boosting—on several metrics, including accuracy, F₀.₅ score, and AUC. In contrast, Ab Ghani, et al. (2019) found that decision trees achieved higher accuracy than LR when predicting student enrollment, although the results for precision and recall were inconclusive. These findings suggest that performance may vary based on the dataset and outcome of interest.
EN has been shown to outperform Lasso in prediction tasks, particularly when predictors are highly correlated. While both methods produce sparse models by selecting a subset of relevant variables, EN’s ability to group correlated predictors can lead to improved performance (Zou and Hastie 2005).
RF consistently improves upon single decision trees by averaging across many trees, thereby reducing variance and enhancing generalization (Breiman 2001). This method avoids the overfitting common to decision trees by introducing randomness in predictor selection. Compared to bagged trees, which also aggregate across multiple trees, RF adds a layer of decorrelation, resulting in improved model diversity and predictive performance (Breiman 2001; James, et al. 2023).
Fernández-Delgado, et al. (2014) conducted a large-scale comparison of classifiers and found that ensemble methods such as RF typically outperforms single-tree and linear models in terms of accuracy. However, these performance improvements often reduce model interpretability. Molnar (2025) notes that interpretability can still be achieved in tree-based ensembles using variable importance plots and partial dependence analysis.
While most existing studies examine machine learning applications at large public universities or across multiple institutions, relatively few investigate their use in predicting enrollment at small, tuition-dependent private colleges. This study addresses that gap by comparing five modeling techniques using the same dataset derived from real-world admissions data. The findings are intended to guide future model selection in similar institutional contexts.
Methods
Data Source and Sample
The dataset was extracted from the university’s Slate CRM system and comprised all admitted undergraduate students from 2018 through 2024. These applicants were prospective first-time undergraduates who had received admission to the institution. The original dataset contained 8,625 observations; however, records missing High SchoolGPA were excluded, as this metric is a required application component and a well-established predictor in higher education models. Consequently, the final sample included 8,594 students. Among this group, enrollment rates ranged from 20.5 percent to 28 percent of admitted students.
Dependent and Independent Variables
In this study, the primary outcome variable was enrollment status, coded as a binary indicator. While a broad range of predictors was initially explored during preliminary analyses, only the variables retained in the final models are discussed here. The primary reason for excluding certain variables was that they did not contribute meaningful predictive value during exploratory analyses. For instance, the month in which a student submitted an enrollment deposit, receipt of a merit-based scholarship, residential status, and U.S. citizenship or permanent residency status were all found to have limited or no predictive utility and were therefore not retained in the final models. Several predictors were constructed or derived from other data sources. For instance, the “home-institution distance” variable was estimated using students’ residential zip codes when available; otherwise, the zip code of their most recently attended high school was used to approximate the distance from the institution.
Financial aid indicators have been shown to play a crucial role in enrollment decisions. DesJardins, Ahlburg, and McCall (2006) highlighted their importance in yield prediction. In this analysis, merit-based aid alone did not emerge as a strong predictor. This led to consideration of alternative financial indicators, particularly the newly implemented Federal Student Aid Index (FSAI), which became available for Fall 2024 applicants. For earlier cohorts, the Expected Family Contribution (EFC) was used instead. To maintain consistency across cohorts, both EFC and FSAI were combined into a single “need level” variable that was more consistently predictive across years. The derivation of this variable is summarized in Table 1.
| Need Level | Score | EFC Range (USD) | FSAI Range (USD) | Description |
|---|---|---|---|---|
| Highest Need | 4 | ≤ 0 | ≤ 0 | Maximum Pell eligibility |
| High Need | 3 | 0 < EFC ≤ 6,656 | 0 < FSAI ≤ 7,500 | Partial Pell/High financial need |
| Moderate Need | 2 | 6,656 < EFC ≤ 15,000 | 7,500 < FSAI ≤ 15,000 | Moderate financial need |
| Lowest Need | 1 | > 15,000 | > 15,000 | Lowest financial need |
| No Need/Missing | 0 | Values not falling into above categories | Values not falling into above categories | No need or missing data |
|
Note: For academic year 2023–2024, $6,656 was the maximum EFC eligible for Pell grant (Federal Student Aid 2023).
|
||||
The outcome variable is enrollment status. The predictors contained 23 variables covering communication, academic, demographic, behavioral, and process milestones. Table 2 shows the list of variables used in the models.
| Variable | Variable Description |
|---|---|
| High School GPA | The student’s high school grade point average, as reported on a 4.0 scale. |
| Common Application | Indicates whether the student applied through the Common Application. |
| First Generation | Indicates whether the student is a first-generation college student. |
| Institutional Connection | Indicates whether the student has a known connection to the institution (e.g., alumni relation or sibling currently enrolled). |
| Male | Indicates whether the student identifies as male. |
| Race Asian | Indicates whether the student identifies as Asian. |
| Race Black | Indicates whether the student identifies as Black. |
| Race Hawaiian | Indicates whether the student identifies as Native Hawaiian or Other Pacific Islander. |
| Race Native American | Indicates whether the student identifies as Native American. |
| Race Two or More | Indicates whether the student identifies as Two or More Races. |
| Race Unknown | Indicates whether the student is classified into Unknown Race. |
| Attended Honors Scholars Event | Indicates whether the student attended a special event for honors-eligible students. |
| Bulk Email Count | Count of mass emails sent as part of automated campaigns. |
| Bulk SMS Count | Count of mass text messages sent as part of automated campaigns. |
| One-to-One Email Count | Count of personalized emails sent via the CRM’s interaction tool. |
| One-to-One SMS Count | Count of personalized text messages sent via the CRM’s interaction tool. |
| Visited Campus | Indicates whether the student visited campus at any point during the admissions process. |
| Need Level | Institutional measure of the student’s financial need level, coded from 0 (no need) to 4 (highest need). |
| Home-Institution Distance | Distance from the student’s home to the institution, calculated using the latitude and longitude of ZIP code centroids. |
| Honors Tag | Indicates whether the student had a high school GPA of 3.5 or above (on a 4.0 scale). |
| No Longer Interested | Indicates whether the student is marked as no longer interested in the institution. |
| Primary Interest | Indicates whether the student is affiliated with an affinity group. |
| Primary Sport | Indicates whether the student is a prospective student-athlete. |
| Enrollment Status | The dependent variable indicates whether the student is enrolled. |
Modeling Techniques
This study sought to evaluate four classification techniques: (1) LR, (2) Lasso, (3) EN, and (4) RF. All models were developed in R. LR and its regularized variants were fitted using the “glm” (“Glm: Fitting Generalized Linear Model” n.d.) and “glmnet” packages (Friedman, et al. 2025), while the tree-based models employed the “randomForest” (Friedman, et al. 2025). Models were trained on admissions data from 2018 to 2023 (n = 7,346) and tested on 2024 data (n = 1248). Hyperparameters for RF were tuned via cross-validation using the “caret” package (Kuhn 2024).
Evaluation Metrics
To evaluate the performance of predictive models of enrollment, five measures (Accuracy, Precision, Recall, F1 Score, and the AUC) were used (Ab Ghani, et al. 2019; Basu, et al. 2019; Cirelli, et al. 2018; Esquivel and Esquivel 2020). Table 3 shows the metrics and their descriptions.
| Metric | Description | Equation |
|---|---|---|
| Accuracy | The proportion of correctly classified observations among all observations. | |
| Precision | The proportion of true positive predictions among both true and false positive predictions. | |
| Recall | The proportion of actual positive cases that were correctly identified by the model. | |
| F1 Score | A combined measure between precision and recall. | |
| AUC | The area under the curve (AUC) ranges from 0.5 to 1, which shows the model’s ability to discriminate between classes across thresholds. An AUC value closer to 1 indicates strong predictive performance, whereas a value near 0.5 suggests the model performs no better than random chance in predicting enrollment status. | |
|
Key: TP = the correctly predicted enrolled students FP = the incorrectly predicted enrolled students TN = the non-enrolled students predicted as non-enrolled FN = the enrolled students predicted as non-enrolled |
||
Results
Descriptive Statistics
Table 4 presents the means and standard deviations for discrete and continuous variables by enrollment status and overall. Compared with students who did not enroll, enrolled students had a lower average high school GPA (M = 3.05, SD = 0.61 vs. M = 3.27, SD = 0.55), a higher number of bulk emails received (M = 69.03, SD = 31.37 vs. M = 56.78, SD = 28.28), and more one-to-one SMS messages from the institution (M = 25.62, SD = 30.85 vs. M = 8.24, SD = 11.63). They also had a higher need level (M = 3.03, SD = 0.97) than non-enrolled students (M = 1.66, SD = 1.64) and tended to live closer to campus (M = 101.98 miles, SD = 232.39) than their non-enrolled counterparts (M = 141.10 miles, SD = 289.64).
| Variable | Enrolled | Non-Enrolled | Overall | |||
|---|---|---|---|---|---|---|
| M | SD | M | SD | M | SD | |
| High School GPA | 3.05 | 0.61 | 3.27 | 0.55 | 3.22 | 0.57 |
| Bulk Email Count | 69.03 | 31.37 | 56.78 | 28.28 | 59.65 | 29.49 |
| Bulk SMS Count | 6.94 | 8.96 | 6.53 | 8.13 | 6.63 | 8.33 |
| One-to-One Email Count | 2.47 | 2.83 | 1.25 | 2.27 | 1.53 | 2.47 |
| One-to-One SMS Count | 25.62 | 30.85 | 8.24 | 11.63 | 12.31 | 19.51 |
| Need Level | 3.03 | 0.97 | 1.66 | 1.64 | 1.98 | 1.62 |
| Home-Institution Distance | 101.98 | 232.39 | 141.10 | 289.64 | 131.95 | 277.79 |
|
Key:
M = Mean SD = Standard Deviation |
||||||
Table 5 summarizes percentages and frequencies for binary variables. Enrolled students were more likely than non-enrolled students to identify as first-generation (46.1 percent vs. 40.3 percent), have an institutional connection (4.9 percent vs. 1.5 percent), attend an honors scholars event (10.4 percent vs. 1.7 percent), and visit campus (88.5 percent vs. 33.0 percent). They were also more likely to have a primary sport (33.9 percent vs. 10.2 percent) and less likely to indicate no longer being interested in the institution (0.3 percent vs. 35.9 percent). In contrast, non-enrolled students were more likely to submit applications via the Common Application (45.4 percent vs. 26.9 percent) and have certain race/ethnicity classifications, such as Asian (1.4 percent vs. 0.5 percent). Overall, notable differences emerged across communication engagement, campus visit behaviors, and application pathways between enrolled and non-enrolled groups.
| Variable | Enrolled | Non-Enrolled | Overall | |||
|---|---|---|---|---|---|---|
| % | n | % | n | % | n | |
| Common Application | 26.9 | 541 | 45.4 | 2,989 | 41.1 | 3,532 |
| First Generation | 46.1 | 927 | 40.3 | 2,653 | 41.7 | 3,584 |
| Institutional Connection | 4.9 | 99 | 1.5 | 99 | 2.3 | 198 |
| Male | 61.7 | 1,241 | 51.4 | 3,384 | 53.8 | 4,624 |
| Race Asian | 0.5 | 10 | 1.4 | 92 | 1.2 | 103 |
| Race Black | 23.5 | 473 | 23.3 | 1,534 | 23.4 | 2,011 |
| Race Hawaiian | 0.1 | 2 | 0.1 | 7 | 0.1 | 9 |
| Race Native American | 0.3 | 6 | 0.5 | 33 | 0.4 | 34 |
| Race Two or More | 9.5 | 191 | 7.9 | 520 | 8.3 | 713 |
| Race Unknown | 1.7 | 34 | 3.9 | 257 | 3.4 | 292 |
| Attended Honors Scholars Event | 10.4 | 209 | 1.7 | 112 | 3.7 | 318 |
| Visited Campus | 88.5 | 1,780 | 33.0 | 2,172 | 46.0 | 3,953 |
| Honors Tag | 15.5 | 312 | 15.5 | 1,020 | 15.5 | 1,332 |
| No Longer Interested | 0.3 | 6 | 35.9 | 2,363 | 27.6 | 2,372 |
| Primary Interest | 12.8 | 257 | 9.8 | 645 | 10.5 | 902 |
| Primary Sport | 33.9 | 682 | 10.2 | 671 | 15.7 | 1,349 |
|
Sample Sizes: Enrolled = 2,011; Non-Enrolled = 6,583; Overall = 8,594
|
||||||
Model Performance
Table 6 summarizes model performance on the test dataset across five evaluation metrics. Overall, all models demonstrated high predictive accuracy, with values ranging from 0.926 to 0.937. RF model achieved the highest accuracy (0.937), slightly outperforming Lasso (0.930) and EN (0.927).
| Model | Accuracy | Precision | Recall | F1 | AUC |
|---|---|---|---|---|---|
| LR | 0.926 | 0.792 | 0.868 | 0.828 | 0.971 |
| Lasso | 0.930 | 0.780 | 0.919 | 0.843 | 0.971 |
| EN | 0.927 | 0.795 | 0.872 | 0.832 | 0.971 |
| RF | 0.937 | 0.784 | 0.957 | 0.862 | 0.972 |
In terms of precision, EN (0.795) yielded the highest value, followed closely by LR (0.792). RF achieved the highest recall (0.957), indicating superior sensitivity compared with Lasso (0.919). The highest F1 Score was also obtained by RF (0.862), with Lasso following at 0.843.
AUC was uniformly high across all models, ranging from 0.971 (LR, Lasso, EN) to 0.972 (RF), which suggested strong discriminative ability. RF marginally outperformed the other methods in AUC, although the differences were minimal. Overall, RF achieved the strongest performance on most metrics, particularly recall, F1 Score, and AUC, whereas EN led in precision.
Table 7 presents the confusion matrix results for the test dataset across four classification models. Each model’s performance is summarized by true negatives (TN), false positives (FP), false negatives (FN), and true positives (TP).
| Metric | TN | FP | FN | TP | PE | AE |
|---|---|---|---|---|---|---|
| LR | 931 | 59 | 34 | 224 | 283 | 258 |
| Lasso | 923 | 67 | 21 | 237 | 304 | 258 |
| EN | 932 | 58 | 33 | 225 | 283 | 258 |
| RF | 922 | 68 | 11 | 247 | 315 | 258 |
|
Key: TN = True Negative FP = False Positive FN = False Negative |
TP = True Positive PE = Predicted Enrollment Count AE = Actual Enrollment Count |
|||||
Among the models, RF achieved the highest true positive count (247), correctly identifying the most positive cases, while also maintaining the lowest false negative count (11), indicating fewer missed positive instances. LR and EN demonstrated similar performance, with 224 and 225 true positives, respectively, and moderately higher false negatives (34 and 33). Lasso achieved the second-best performance on false negatives (21), behind RF (11), indicating stronger sensitivity than LR and EN.
False positives, representing instances incorrectly classified as positive, varied across models. EN produced the fewest false positives (58), followed closely by LR with 59. RF and Lasso had slightly higher false positives at 68 and 67, respectively. This indicates that although RF excels at capturing true positives, it does so with a modest increase in false alarms.
In terms of predicted headcount, RF overestimated PE by 22 percent compared to AE (315 vs. 258), whereas LR overestimated PE by 9.7 percent (283 vs. 258).
Overall, the results suggest a trade-off between maximizing true positive detection and minimizing false positive errors. RF demonstrated strong sensitivity, with a slight increase in false positives, while LR and EN offer a more conservative approach with fewer false positives but at the expense of higher false negatives.
Predictor Effects for Regression Techniques
Table 8 presents the coefficients for the top predictors of enrollment across LR, Lasso, and EN models. The LR model additionally reports statistical significance. Penalized models (Lasso, EN) provide coefficient estimates without p-values, so significance symbols are not applicable.
| Variable | LR | Lasso | EN |
|---|---|---|---|
| Intercept | -2.6122a | -2.6025 | -2.5921 |
| High School GPA | -0.6354a | -0.6147 | -0.6199 |
| Need Level | 0.5088a | 0.4987 | 0.4989 |
| One-to-One Email Count | 0.1552a | 0.1531 | 0.1537 |
| One-to-One SMS Count | 0.0283a | 0.0278 | 0.0278 |
| Bulk SMS Count | -0.0354a | -0.0317 | -0.0325 |
| Bulk Email Count | 0.0106a | 0.0100 | 0.0102 |
| Male | 0.1618 | 0.1448 | 0.1509 |
| Race–Black | -0.3914a | -0.3605 | -0.3717 |
| Race–Unknown | -0.8941a | -0.8253 | -0.8478 |
| Race–Two or More | -0.2547 | -0.2185 | -0.2326 |
| First Generation | 0.2252b | 0.2109 | 0.2146 |
| Honors Tag | -0.2614c | -0.2301 | -0.2399 |
| Institutional Connection | 0.8475a | 0.8186 | 0.8280 |
| Primary Sport | 0.9913a | 0.9595 | 0.9630 |
| Primary Interest | 0.2119 | 0.1747 | 0.1848 |
| Common Application | -0.1462 | -0.1372 | -0.1425 |
| No Longer Interested | -5.0971a | -4.7751 | -4.6061 |
| Visited Campus | 1.9724a | 1.9561 | 1.9508 |
| Attended Honors Scholars Event | 1.1571a | 1.1193 | 1.1299 |
| Home-Institution Distance | – | 0.0000 | 0.0000 |
| Race–Native American | – | -0.3889 | -0.4315 |
| Race–Hawaiian | – | 0.0000 | 0.0000 |
| Race–Asian | – | -0.2134 | -0.2591 |
|
Key: LR = Logistic Regression EN = Elastic Net |
Significance Levels:
|
||
In the LR model, the strongest negative association with enrollment was No Longer Interested (β = –5.10, p < 0.001), indicating that students marked as No Longer Interested were substantially less likely to enroll. Other strong negative predictors included Race–Unknown (β = –0.89, p < 0.001) and Race–Black (β = –0.39, p < 0.001), suggesting a lower likelihood of enrollment compared to the reference group (Race – White).
In contrast, Visited Campus (β = 1.97, p < 0.001) was the most influential positive predictor, with students who visited campus showing a much higher probability of enrolling. Similarly, Primary Sport participation (β = 0.99, p < 0.001) and Institutional Connection (β = 0.85, p < 0.001) were strong positive drivers, indicating that athletic recruitment and existing relationships with the institution are important enrollment motivators.
Academic performance, as measured by High SchoolGPA (β = –0.64, p < 0.001), showed a negative coefficient, meaning lower GPA was associated with higher enrollment among admitted students. Communication-related variables such as One-to-One Email Count (β = 0.16, p < 0.001) increased the likelihood of enrollment, whereas Bulk SMS Count (β = –0.04, p < 0.001) slightly reduced it, suggesting that more personalized outreach is more effective than mass messaging for the applicants.
Penalized models (Lasso, EN) produced similar coefficient patterns but with magnitudes slightly shrunk toward zero. Some variables absent in LR (e.g., Race–Native American, Race–Asian, Home-Institution Distance) had small nonzero coefficients in Lasso and EN, reflecting their potential minor contribution when penalization is applied.
Overall, across modeling approaches, the most influential positive predictors were campus visit, athletic affiliation, and institutional connections, while the strongest negative predictor was explicit disinterest.
Variable Importance from Random Forest
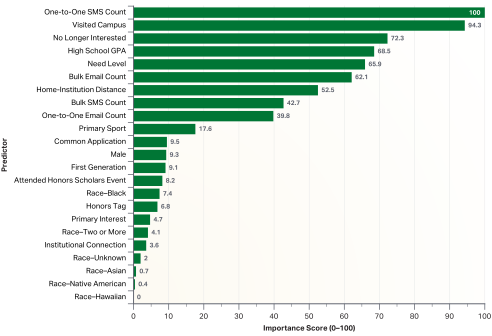
Figure 1 summarizes the variable importance scores from RF model, scaled to a 0–100 range using min–max transformation (Han , Kamber, and Pei. et al. 2012; Wickham Wickham, Pedersen, and Seidel. et al. 2025). The results highlight that the One-to-One SMS Count was the most influential predictor (importance = 100), suggesting that personalized text messaging is a key engagement driver for enrollment. The variable Visited Campus followed closely (94.3), reinforcing the strong positive relationship observed in regression models between campus visits and enrollment.
(Figure 1)
No Longer Interested ranked third (72.3), indicating that explicit disengagement signals are highly predictive of non-enrollment outcomes. Academic and financial indicators also featured prominently: High School GPA (68.5) and Need Level (65.9) both had substantial importance scores, underscoring the influence of academic preparedness and financial aid need in enrollment decisions.
Other variables with moderate importance included Bulk Email Count (62.1) and Home–Institution Distance (52.5), pointing to the relevance of outreach frequency and geographic proximity. Bulk SMS Count (42.7), One-to-One Email Count (39.8), and Primary Sport (17.6) were less important than personalized SMS but still contributed meaningfully to predictions.
Lower-ranked variables, such as Common Application (9.5) and demographic indicators (e.g., Male = 9.3, Race–Black = 7.4), suggest secondary or niche effects in the model’s decision process. Variables like Race–Hawaiian (0) and Race–Native American (0.4) had negligible importance, indicating minimal contribution to classification accuracy in the RF model.
Overall, the RF results corroborate many high-impact predictors from the regression analysis, particularly campus visits, personalized outreach, and explicit interest signals—while also capturing the relative predictive weight of less prominent variables within a non-parametric framework.
Discussion
The present study compared the predictive performance of four modeling techniques (LR, Lasso, EN, and RF) for forecasting enrollment outcomes among admitted students. The results revealed meaningful differences in model performance across precision, recall, and overall accuracy, highlighting that the optimal choice of model should be aligned with institutional priorities and resource constraints.
Among the tested models, RF achieved the highest overall accuracy (93.7 percent) and recall (95.7 percent), minimizing false negatives while maintaining competitive precision. In practical terms, this means RF identified the largest proportion of actual enrollees, making it well-suited for scenarios where maximizing outreach to potential enrollees is critical—even if it results in contacting some students who ultimately do not enroll (i.e., accepting a higher false positive rate). This property is advantageous in early recruitment phases or when the goal is to ensure that no high-potential students are overlooked. These results are consistent with theoretical expectations that ensemble methods can capture complex, nonlinear relationships (Hastie, Tibshirani, and Friedman 2009; James, et al. 2023) and provide empirical support for RF’s advantage over regularized regression models in this context.
Conversely, LR and EN achieved higher precision than RF, indicating they were more effective at minimizing false positives. Such models are especially valuable when institutional resources—such as counselor time, travel budgets, or scholarship allocations—are constrained and must be directed toward students with the highest likelihood of enrolling. Lasso, while slightly less precise than LR and EN, offered a balanced trade-off between identifying true enrollees and avoiding misclassification, making it a viable middle-ground approach.
From an operational standpoint, these findings reinforce that no single model universally outperforms others across all metrics. Instead, institutions should adopt a model selection strategy guided by their recruitment objectives. For example, an admissions office with the capacity for broad outreach may benefit from deploying a high-recall model like RF, whereas an office facing tight staffing or budgetary constraints may prefer the precision of LR or EN. Hybrid approaches—using high-recall models early in the cycle and high-precision models later—could provide the best of both worlds. Classification threshold adjustment can also be used to restrict precision and recall. Adjusting classification thresholds offers another means to fine-tune precision and recall.
Model interpretability revealed notable differences in variable prioritization. RF assigned its highest importance scores to behavioral variables—particularly campus visits (importance = 94.3) and One-to-One SMS Count (100)—suggesting that direct engagement plays a central role in predicting enrollment. In contrast, LR and EN placed greater weight on socioeconomic indicators such as financial need. Interestingly, Home–Institution Distance was dropped in LR and received minimal weight in Lasso and EN but was moderately important in RF (52.5). This suggests possible nonlinear or interaction effects, potentially in combination with variables like sport affiliation (Primary Sport).
These insights suggest four key priorities for enrollment management:
- Invest in high-touch recruitment strategies that emphasize campus visits and personalized communication.
- Leverage nonlinear patterns—such as the influence of distance—to identify untapped recruitment opportunities.
- Select predictive models based on recall–precision trade-offs that align with institutional goals and resources.
- Integrate predictive outputs into CRM platforms to optimize outreach and forecasting.
Finally, model choice has implications for transparency and stakeholder trust. LR and EN offer greater interpretability, making them easier to explain to nontechnical audiences, whereas RF requires post-hoc tools (e.g., SHAP) to clarify predictions. Future research should extend this analysis to multi-institution datasets, incorporate experimental designs to assess the causal impact of outreach strategies, and explore advanced methods such as ensemble stacking and SHAP-based explanations to improve both predictive performance and interpretability.


share