Commentary
Artificial Intelligence and College Enrollment Decisions
Just the American Educational Research Association (AERA) article title “How an Artificially Intelligent Virtual Assistant Helps Students Navigate the Road to College” made me think “Fascinating!” and then about Skynet, the Matrix, and Ava (Ex Machina) all at once. I had to read the whole thing. Georgia State University used conversational artificial intelligence (AI) to support prospective college students through personalized text messages. The researchers used a field experiment to determine if students who were engaged with this AI were more successful in completing the pre-college tasks and enrolling on time than those who were not engaged with the AI. Overall, they found that those students who had committed to GSU and were engaged with the AI were 3.3% more likely to enroll in GSU in the fall than those who were not exposed to the AI. If this were applied to the entire cohort of about 3,500, about 116 more students would matriculate. This intervention also had a larger positive impact on first-generation students’ ability to navigate the financial aid process.
The built-in Q&A set started at 250, and by the end of the intervention it was more than 1,000 based on the AI learning from the engagements with the students. Most of the students in the treatment group did not opt out of the engagement with the “Pounce” AI, and 85% of those who opted in responded to Pounce at least once. Just 13.5% of the messages received from the students could not be handled by Pounce automatically and were routed to staff, which in the end averaged less than one message per student in the treatment group. I believe this is just the tip of the iceberg for the use of such systems to help with the college enrollment process, and it fascinates me to no end. Will this technology ultimately mean institutions will need fewer staff to engage with prospects directly or will those engagements become more personal because staff won’t have to address FAQs?
AACRAO Research Update
March 60-Second Survey Topic
The March 60-Second survey results will provide insights into pre-college programs that we have defined as follows for the purpose of the survey: “University sponsored/organized programs and activities for K-12 school participants typically not yet enrolled in college as degree-seeking students.” The survey will be deployed on March 5 and close at the end of the week.
Emma Crabtree M.A. – Research Intern

We are pleased to introduce Emma Crabtree. Emma joins us as our research intern to help with the project on credit loss comparing direct entry students to transfer students at a large university. This is a three part project entailing data analysis, a soon-to-graduate student survey, and student focus groups. We aim to expand on the current understanding of the reasons why students have excess credits at graduation by examining student engagement behaviors.
Emma is a Doctoral Candidate in the Community Psychology program at Wichita State University. She is passionate about research related access to education and academic success for college students. She is excited to do research with such a large data set and hopes to learn more about the relationship between internal policies and graduation. After finishing her dissertation in a year, she hopes to consult on data reporting and program evaluation. Her goal is to work in the Grants office at the Wichita Children's Home, an organization providing emergency, temporary, residential care for children in the Wichita community.
Current Higher Education Research and Related Topics
Geography, Internet Speed and Access to Higher Education
The Urban Institute used data from IPEDS, the Federal Communications Commission, the American Community Survey, and the U.S. Census to examine “education deserts” - those areas where students do not have access to higher education. The authors identified three types of education deserts--physical education desert only, online education desert only, and both physical and online—and identified the percentage of people living in each ( see figure below). Eighty-two percent of people living in education deserts live in rural areas, and those from rural areas are likely to be older, from lower median family incomes, and have lower educational attainment.

New Stats in Brief Report on First Generation College Students
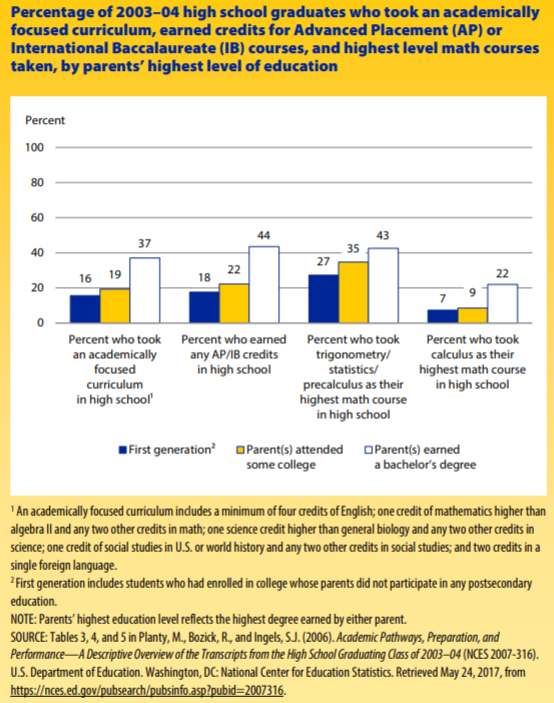
Authors from the NCES examined data from the Educational Longitudinal Study of 2002, the 2004-2009 Beginning Postsecondary Students Longitudinal Study, and the 2008/12 Baccalaureate and Beyond Longitudinal Study to address the following three questions:
- “How do high school students whose parents did not enroll in college fare in high school compared with their peers whose parents attended at least some college? At what rates do these groups transition to college and in what types of institutions do they enroll?
- Compared with students whose parents attended at least some college, how do first-generation students fare after enrolling in postsecondary education? At what rates do they attain degrees or certificates or remain enrolled?
- >Among bachelor’s degree recipients, how do first-generation students fare compared with their continuing generation peers in the labor market or further postsecondary enrollment?”
A few of the key findings are included in the figure below.

Student Loan Default Crisis Worse Than Expected
Brookings analyzed data on student debt and repayment, which includes previously unavailable details on student debt and default, from first college entrance to 20 years later. Based on the 1996 entry cohort, cumulative default rates continue to rise between 12 and 20 years after entry and, based on this data, up to 40 percent may default by 2023. The data show that for-profit borrowers default at twice the rate of public two-year borrowers; defaults are highest among those who borrow less; and black students who earn a BA have a default rate of 21% compared to white BA graduates at 4%. The author concludes that these data point to a need for efforts to “regulate the for-profit sector, to improve degree attainment and promote income-contingent loan repayment options for all students, and to more fully address the particular challenges faced by college students of color.”
CCRC Uses Data Mining to Understand Transfer Students Excess Credits at Graduation
The Community College Research Center recently announced a working paper on the cause of excess credits at graduation among transfer students compared to direct-entry students. They used transcript data from two state systems to look at course-taking behavior to help shed light on the issue. They conclude that those students--transfer or direct-entry--who take 100- and 200-level courses in a way that subsequently lets them take mostly 300- and 400-level courses after 60 earned semester credit hours graduate with fewer excess credits on average.
First Look Report Fall 2009 Ninth-Graders in 2016
NCES
released a First Look report based on the 2015-16 National Postsecondary Student Aid Study on how students and families pay for postsecondary education at Title IV eligible institutions. Among their conclusions, the authors found:
- Nearly two-thirds of undergraduates receive some type of financial aid, and of those, 69% receive grants, and 38% receive loans.
- The average amount of aid received was $12,300
- The average Pell grant was $3,700
- The same percentage of graduate students as undergraduate students received some type of financial aid.
- Among those, 8% received assistantships, 40% grants, and 44% loans.
- The average amount of aid received was $22,000
- The average assistantship was $13,400
Independent Students Now the Majority of College Students in U.S.
The Institute for Women’s Policy Research created a
snapshot of the new majority college student, the independent student. A few of their key findings which compare independent students to dependent students are paraphrase here:
- More than a decade older on average
- More women than men
- More likely to be students of color
- More than half are parents of children younger than 18 and of those almost two-thirds are mothers
- Have a substantial unmet financial need
- More likely to work at least half time
- 44% are part-time compared to 19%
- Just 33% graduate within 6-years compared to 56% of dependent students
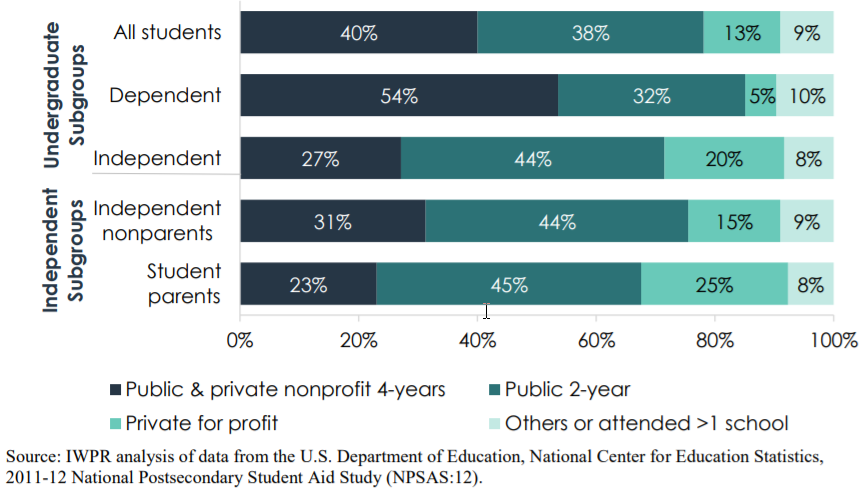
- Significantly more likely to attend for-profit colleges (see figure from snapshot below)

From this analysis, they made several recommendations for colleges, federal data systems, financial aid eligibility and employers. Including training college personnel to understand the circumstances of independent students, encouraging employers to create more fixed schedules to allow for class time and dependent care in advance, and revising financial aid eligibility.
An Introduction to Development Education for Policymakers
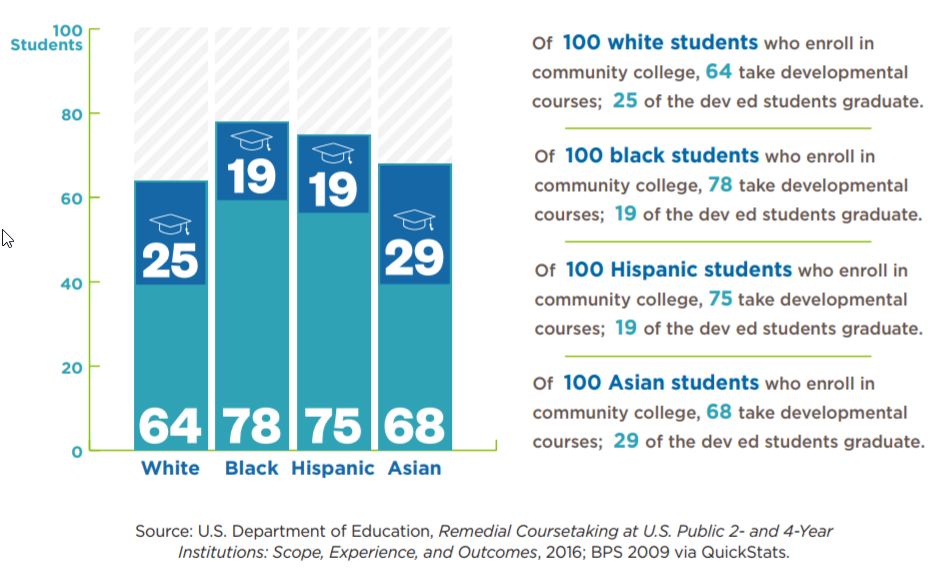
The Center for the Analysis of Post secondary Readiness in the Education Commission of the States collaborated on an introduction on the importance of developmental education, the challenges and how policy makers can help. Challenges include the fact that placement tests are inaccurate placing too many students in developmental education courses and students do not make it through the sequence. In addition, the 6-year rate for earning a credential among these students are not good (figure from their paper below).

Among the recommendations are the following:
-
Improve the accuracy of assessment testing
-
Provide structured course pathways
-
Consider wraparound supports
WICHE Regional Fact Book Updates
WICHE releases updated Regional Fact Book tables and added a new table on state-by-state workforce projections.
Higher Education State Policy Issues for 2018
The American Association of State Colleges and Universities released its policy issues report for 2018.
How Students Use Federal, State and Institutional Aid
The Education Commission of the States created a primer for policymakers on how students use aid from multiple sources to pay for college.
Upcoming NISOD Webinars
The National Institute for Staff and Organization Development (NISOD) is offering a set of webinars on student engagement and retention over the next few months. These webinars are free for members and $25 for non-members.