Distribution of Members by Gender
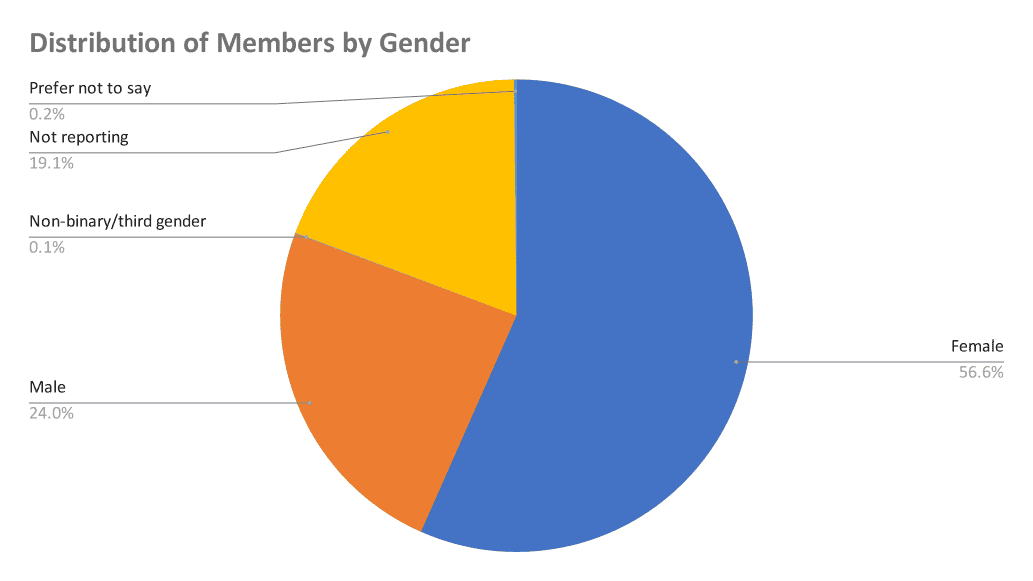
For over 20 years the AACRAO membership has been comprised of at least 50% women. According to a 2016 article from Inside Higher Ed, “women made up approximately half of higher education administrators across the country…[and] more than 50% of department heads are women.”
Gender identity has become an important issue on campuses for student and administrators. Keep track of the ongoing issues with AACRAO’s Trending Topic on Gender Identity/Expression.
Distribution of Members by Ethnicity
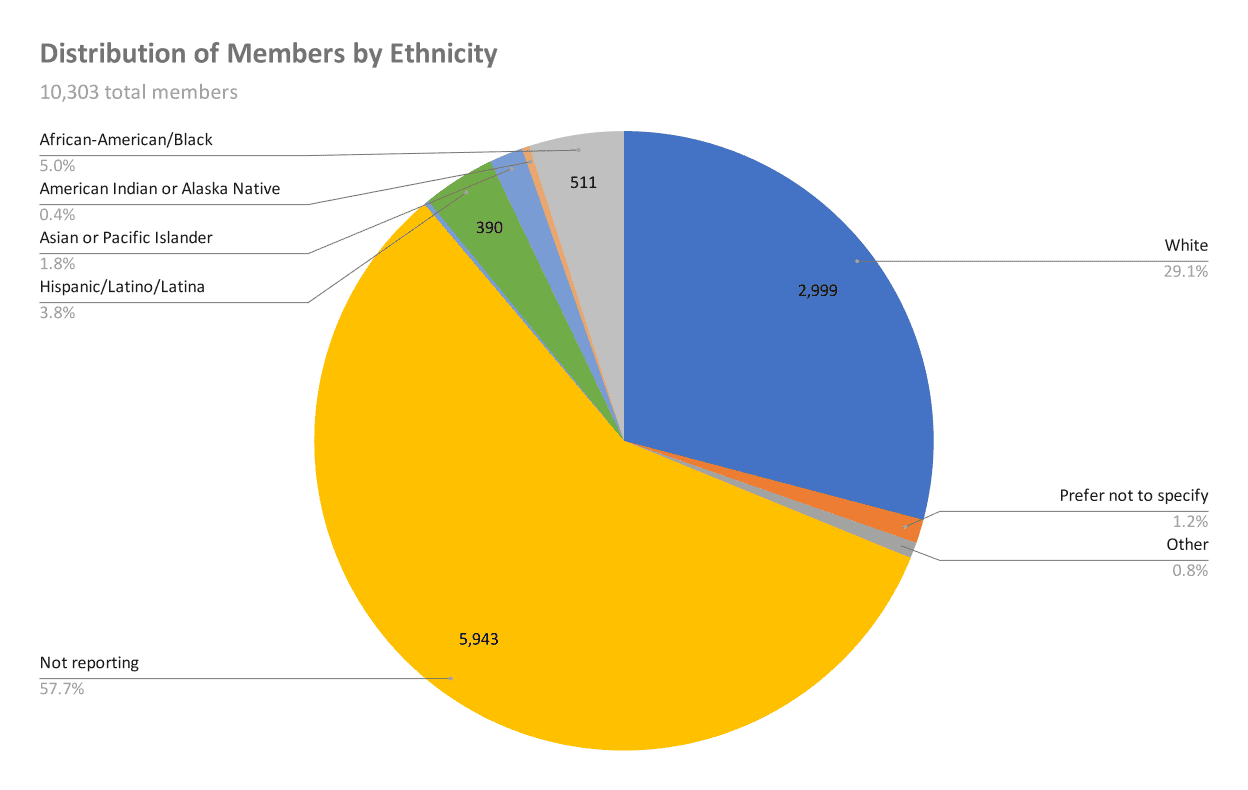
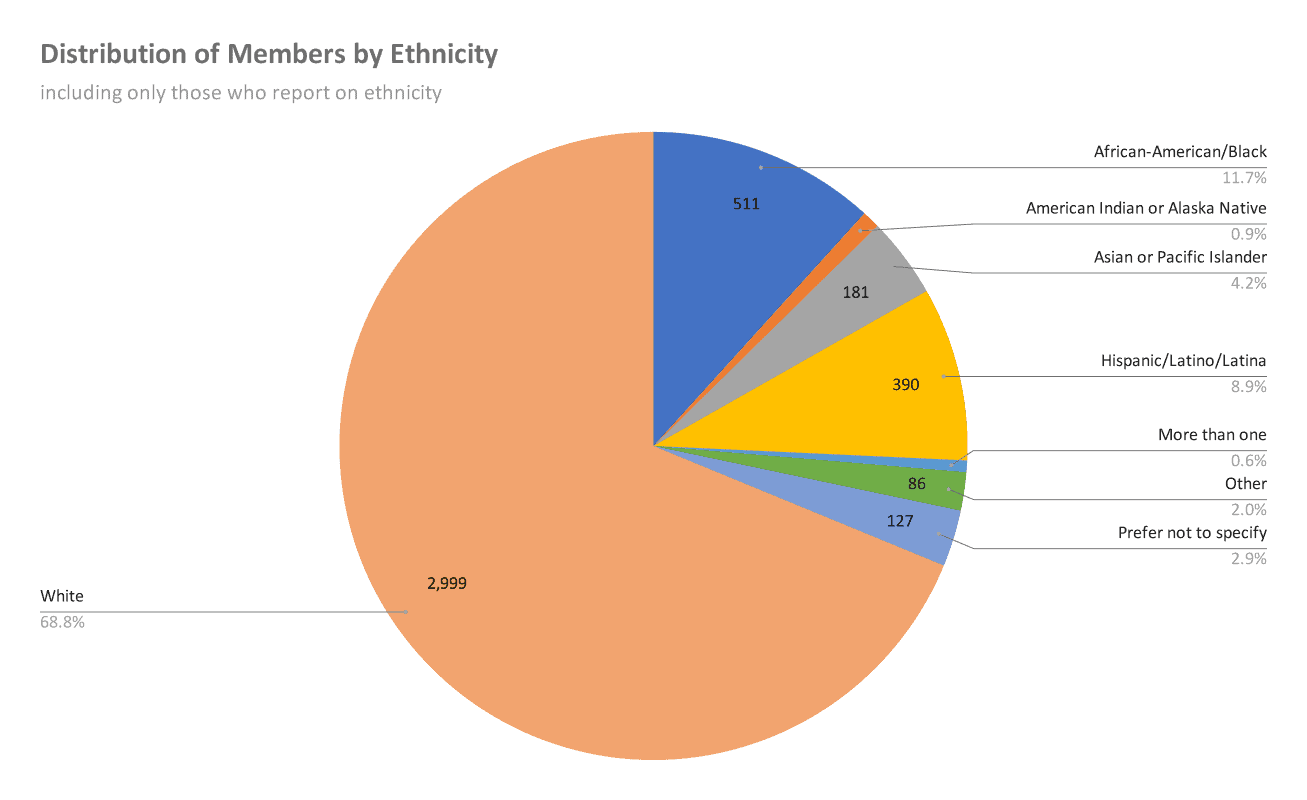
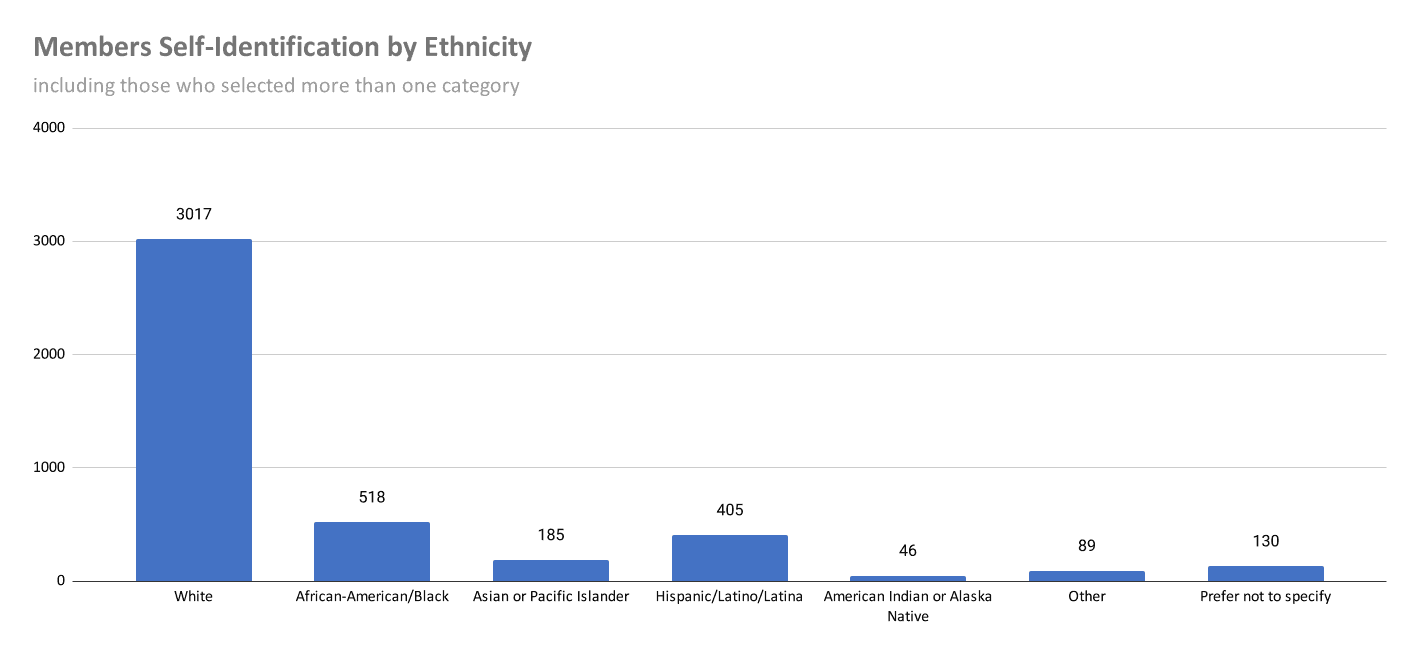
While just under 60% of AACRAO members do not report on ethnicity, the data from those who do report shows that AACRAO members are a diverse group that is generally reflective of the higher education industry as a whole. How similar is AACRAO’s membership to the general trends of U.S. higher education? Check out this IPEDS report to compare for yourself.
AACRAO Committees, specifically those in Group 5, are in place to ensure that our members, and their students, get the recognition they need to succeed in their education and their careers.
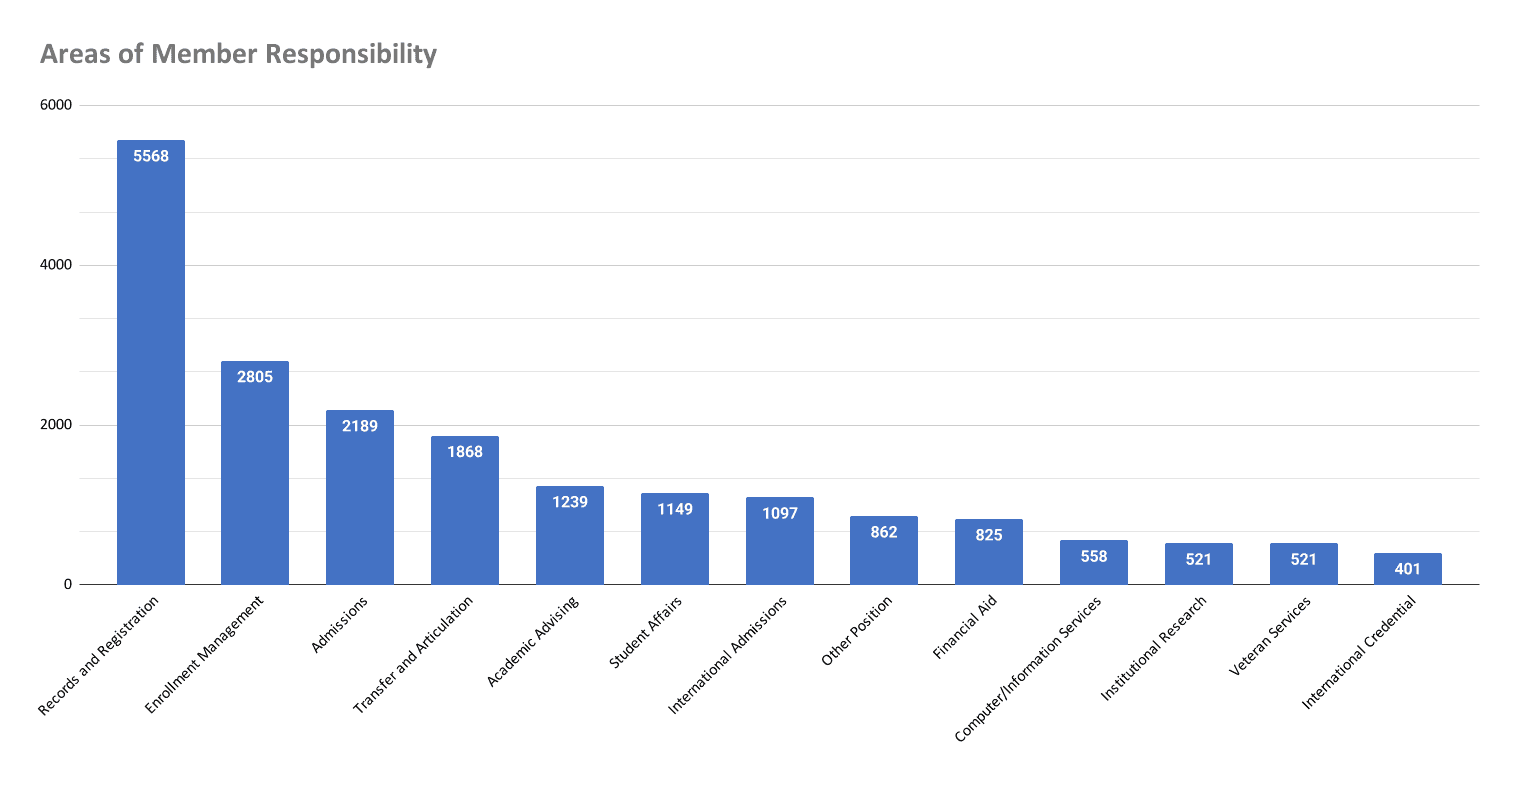
Number of Areas of Work Assigned to Each Member
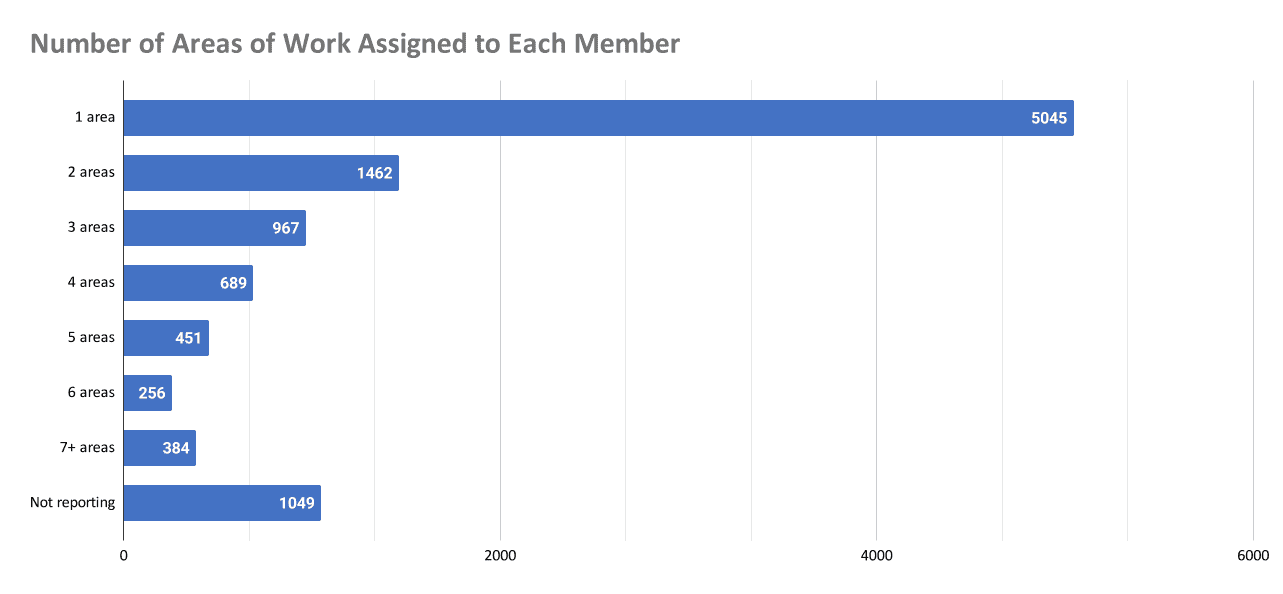
At their institutions, AACRAO members are assigned duties that reach nearly every aspect of the university. As evident from the chart above, many members have duties that fall into several categories. AACRAO offers direction on each of these categories so that we can help members perform to the best of their abilities. AACRAO publications are one of the best ways for members to access that guidance. Browse through the publications in your field and see if AACRAO can help.
Member Distribution by Institution Size
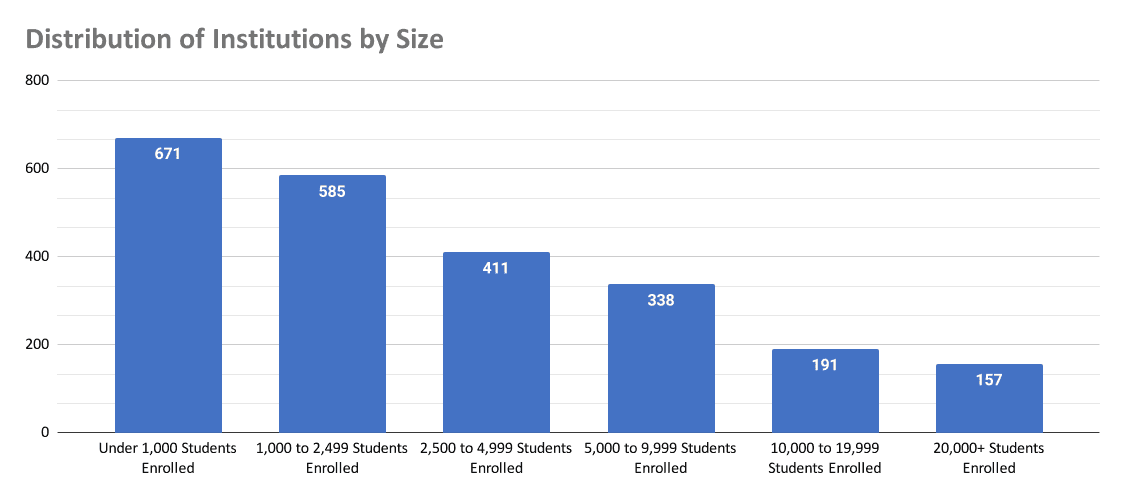
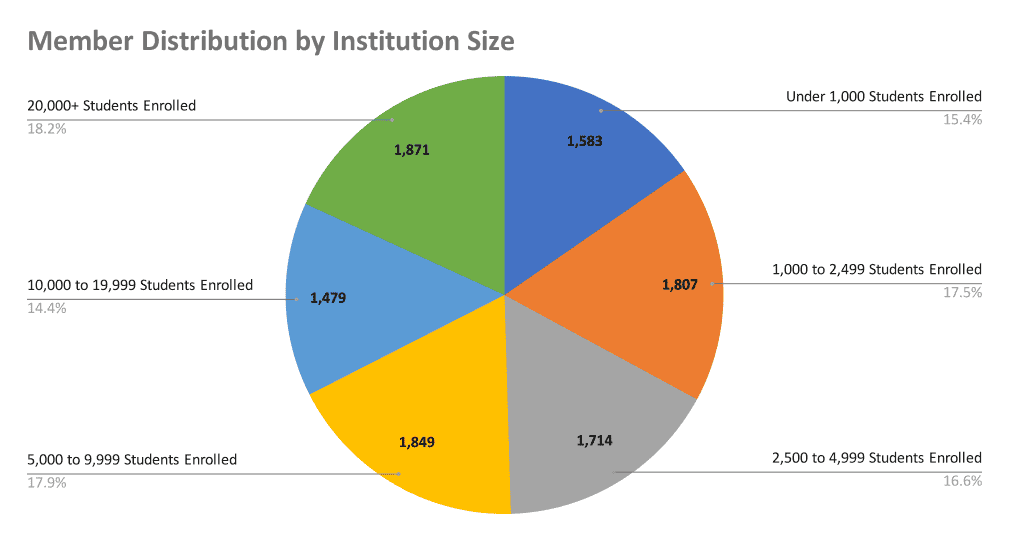
All AACRAO institutional members fall into one of six size codes based on institutional enrollment. As evident from the above bar graph, most of AACRAO’s institutional members are in the smallest two size codes, which include schools with fewer than 2,500 students. There are more institutions of this size than the four larger size codes combine! However, when looking at the distribution of individuals across those size codes a much more even spread is clear, which means that institutions of all sizes are represented and have equal opportunity to have their voices heard.
Distribution of Members by Control
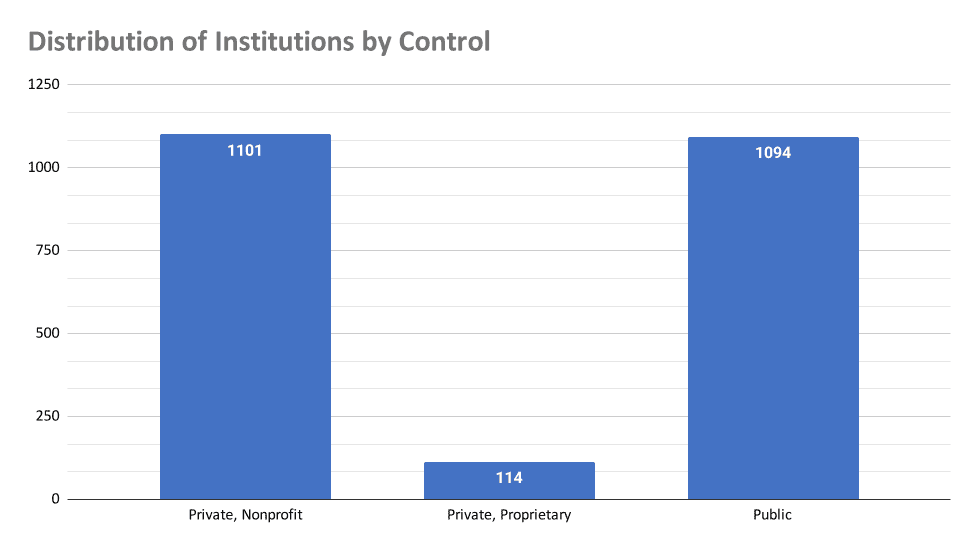
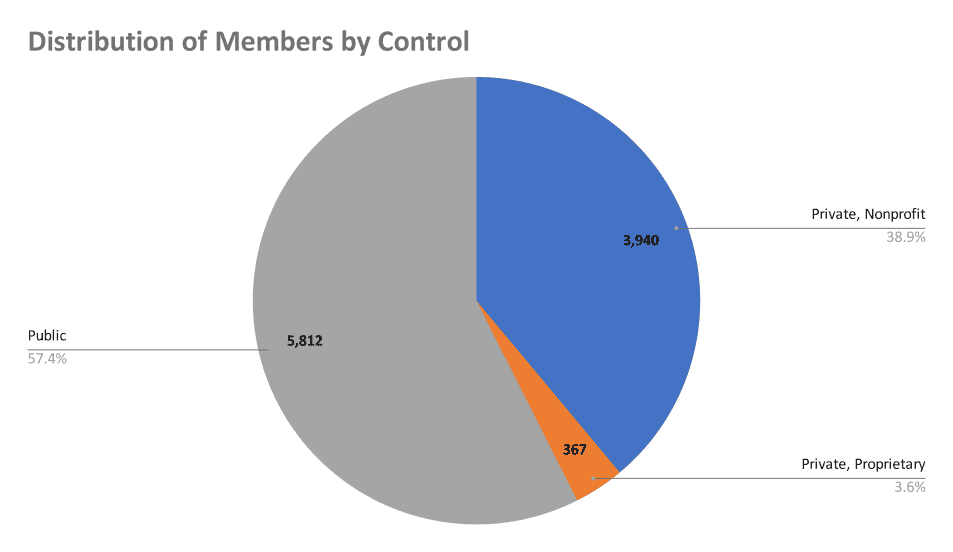
With the closing of several large for-profit college systems in the past few years, AACRAO has seen a small decline in the number of proprietary schools as members. Governmental regulations on higher education always vary depending on the current administration, and the shakeup in those regulations can have serious and lasting impacts. AACRAO hopes to help our members remain up to date on all changes which could impact their careers and their institutions. The AACRAO Transcript provides members with timely court, industry and international news as well as the latest developments in the areas of federal relations and compliance.
Distribution of Members by Class
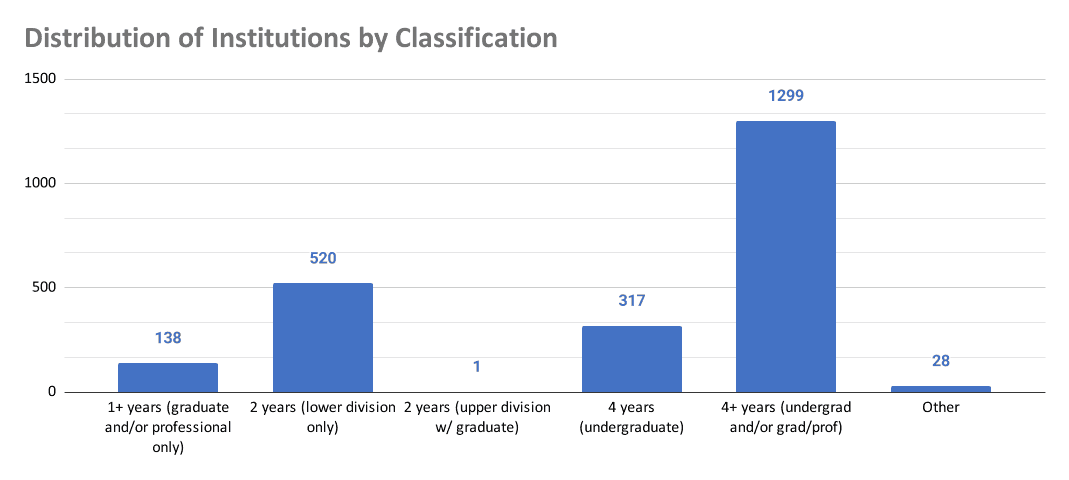
“Until the Civil War, the American college system was based on the English model. Most colleges stood alone, rather than being part of a university and the baccalaureate was the only degree awarded. Since there was little opportunity for postbaccalaureate study in the United States, students sought higher education abroad. … Higher education based on the European model, with major emphasis on graduate programs, was achieved in America with the establishment of Johns Hopkins University in 1876.” Take a look at this chart from the National Center for Education statistics that shows the number of degrees granted since 1869. You’ll notice very few graduate degrees were granted until about 1900.
Perry, M.R. 1979. Preparing for commencement. In Admissions, Academic Records, and Registrar Services: A Handbook of Policies and Procedures, edited by James C. Quann. San Francisco: Jossy-Bass
Institutional Members, United States
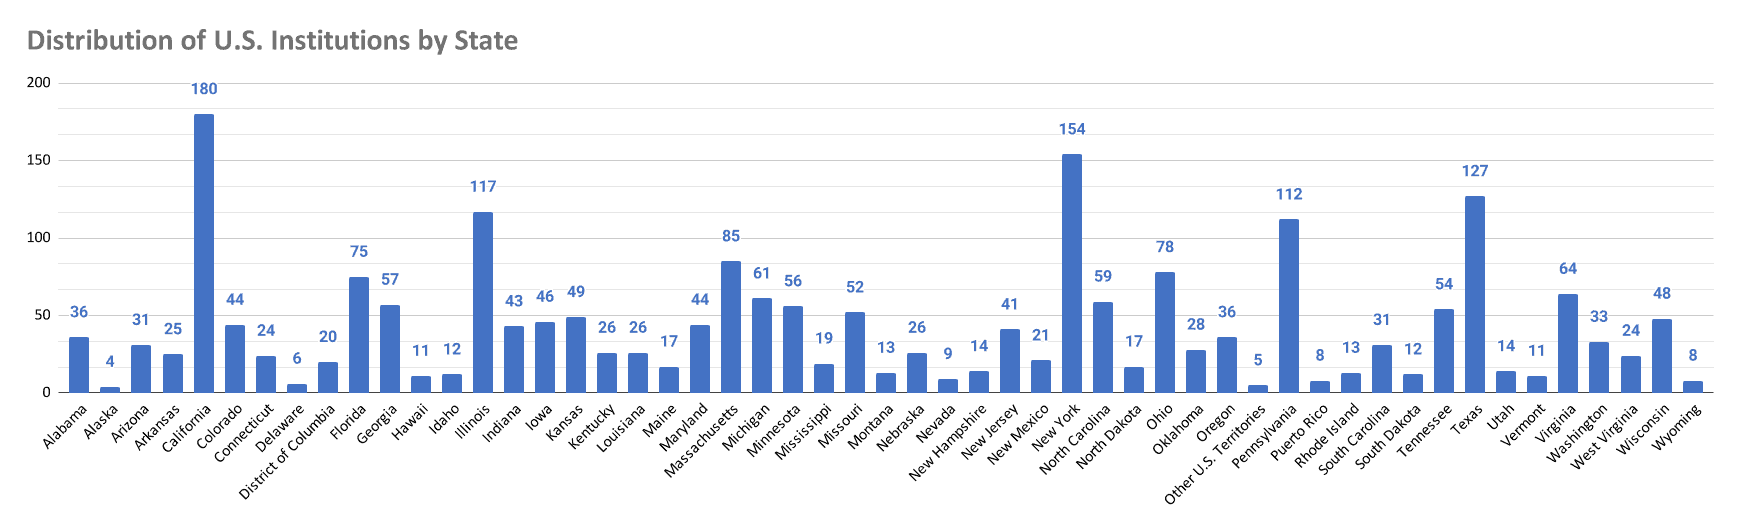
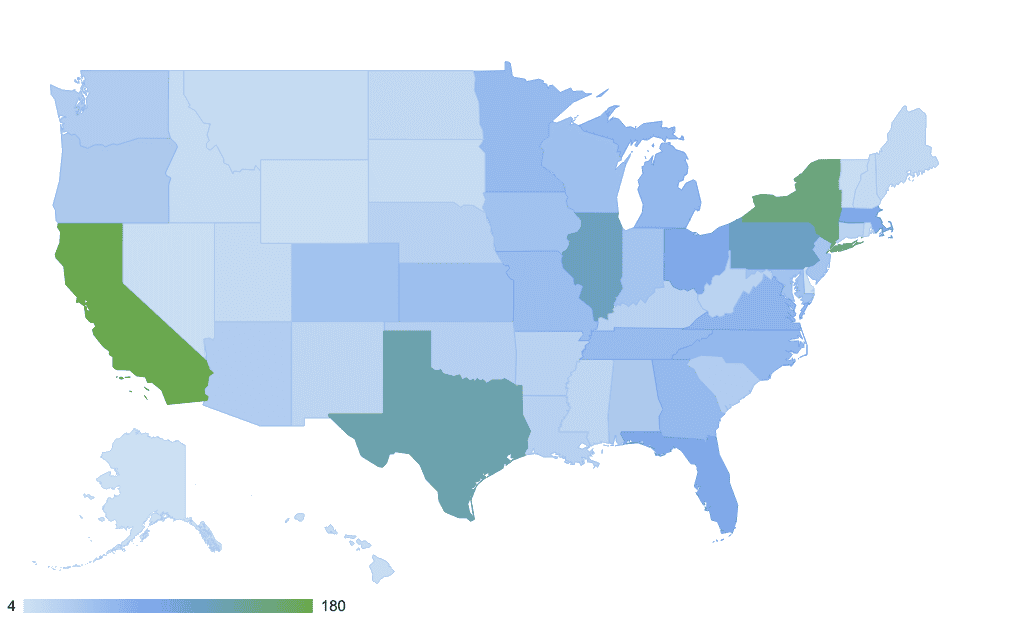
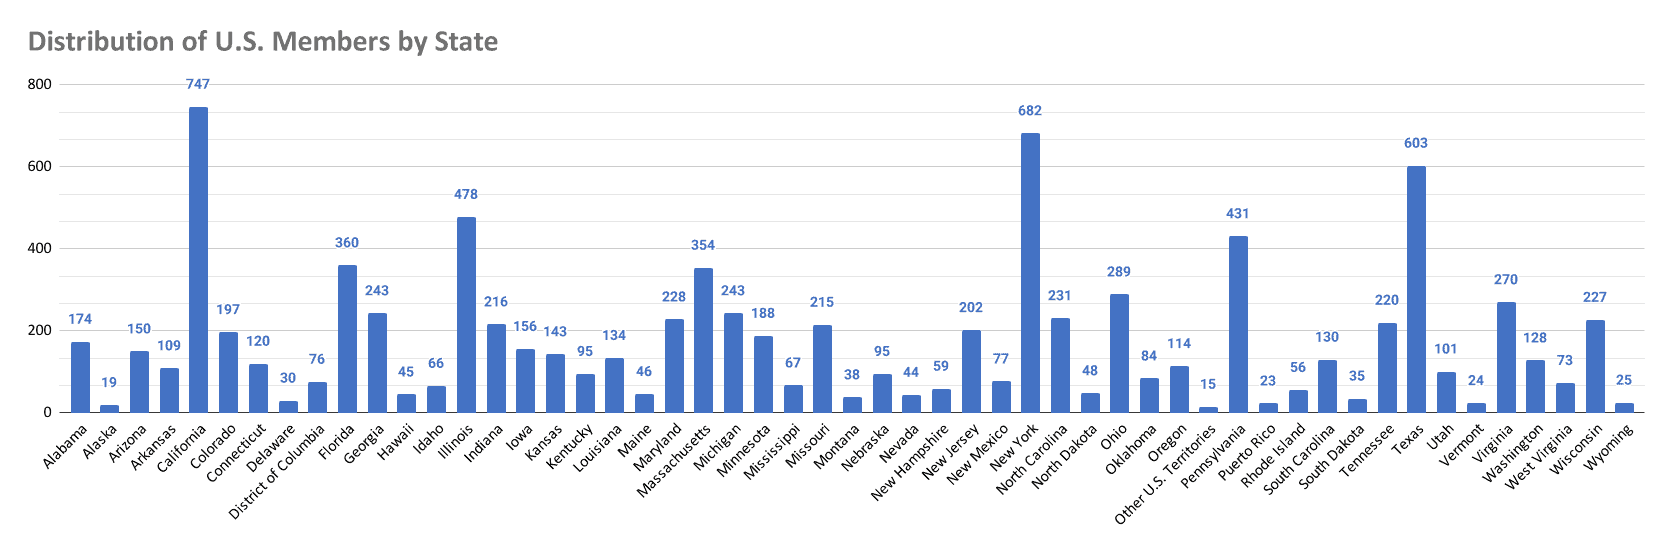
While AACRAO has members in all 50 states, California has the most members when counting by institution and people. AACRAO’s largest states: California, New York, Pennsylvania, Texas and Illinois account for a total of 686 institutions. That’s roughly 30% of AACRAO’s membership in just 5 states.
Institutional Members by Country, Outside the United States
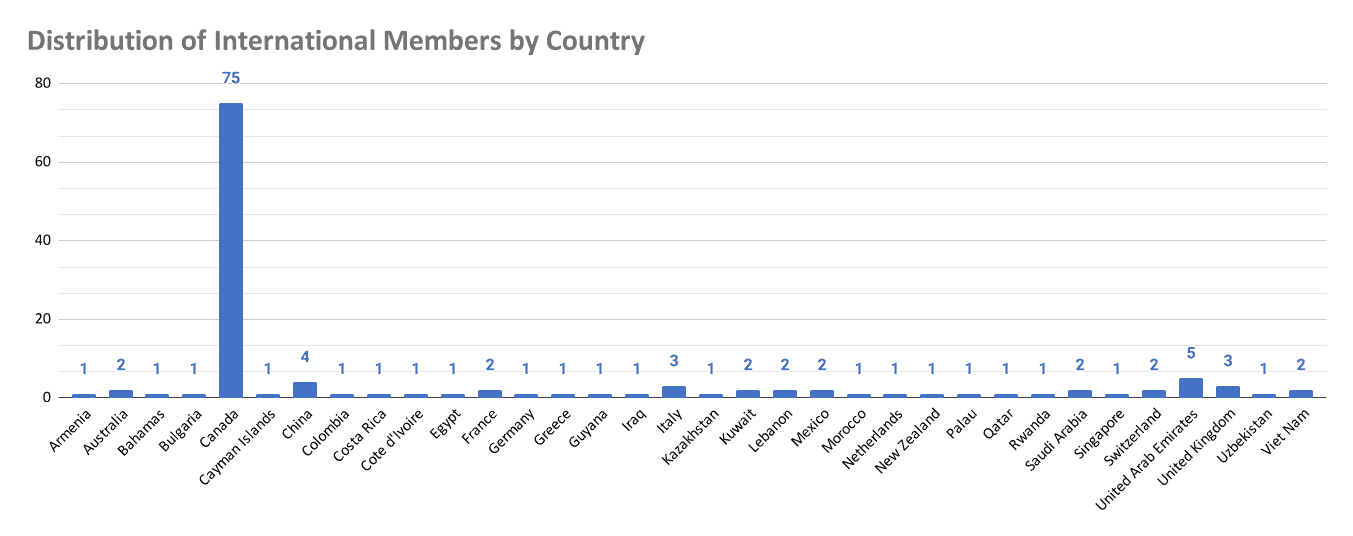
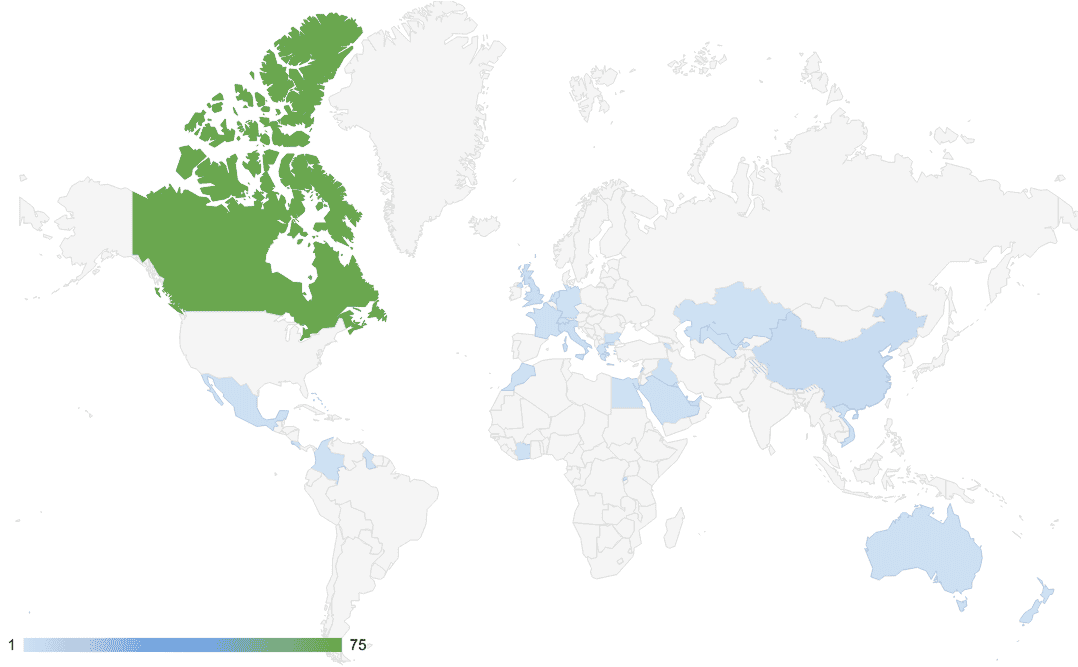
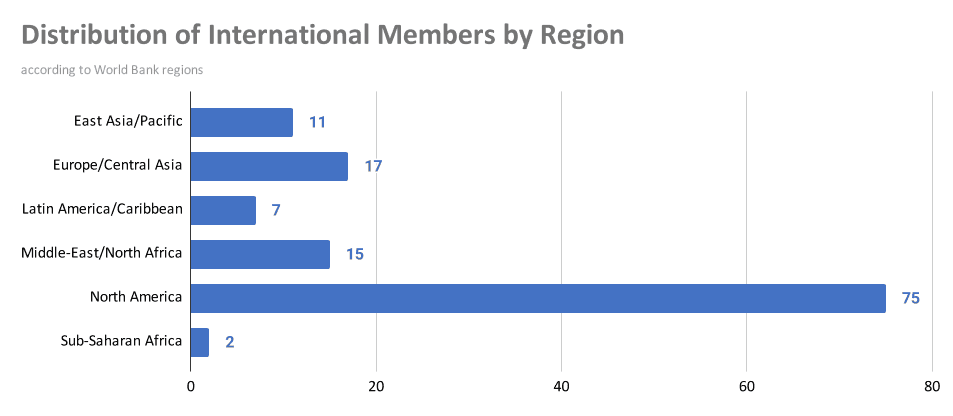
AACRAO has members institutions from 30 countries around the world. While most of these countries have only one or two member institutions, Canada has 75. That accounts for roughly 60% of AACRAOs international members!
Have Questions?
Email membership@aacrao.org or communications@aacrao.org.
Review our Privacy Policy to see how our organization collects and uses data.